


IoT | TensorFlow-weerstation voorspelt regenvalintensiteit
Componenten en benodigdheden
| × | 1 | ||||
 |
| × | 1 | |||
| × | 1 | ||||
 |
| × | 1 | |||
 |
| × | 1 | |||
 |
| × | 1 | |||
 |
| × | 2 |
Benodigde gereedschappen en machines
 |
|
Apps en online services
 |
| |||
 |
| |||
 |
|
Over dit project
Vooral in 2020 hebben onmiddellijke zware en gewelddadige regenval nadelige gevolgen gehad voor kassen en gewasopbrengsten in mijn land. Helaas komen onverwachte en buitensporige regenval tegenwoordig vaker voor en werd het relatief vaak voor als gevolg van klimaatverandering in sommige gebieden. Ondertussen hebben andere regio's last van droogte. Naarmate 2020 verstrijkt, worden in mijn regio meer dan vijfendertig incidenten geregistreerd die het verlies van gewassen en vee hebben veroorzaakt als gevolg van zware en gewelddadige regenval. Om bij te dragen aan de oplossing om door overmatige regenval veroorzaakte problemen zoals productiviteitsverlies in de landbouw te voorkomen en te voorkomen, beschouwde ik dit project als een startpunt.
In dit project heb ik me voornamelijk gericht op overmatige regenvaleffecten op de landbouw. Overmatige regenval kan echter leiden tot tal van gevaren, bijvoorbeeld [1]:
- overstromingen, inclusief risico voor mensenlevens,
- schade aan gebouwen en infrastructuur,
- verlies van gewassen en vee,
- aardverschuivingen, die mensenlevens kunnen bedreigen, transport en communicatie verstoren.
Zoals blijkt uit de laatste onderzoeken, kan overmatige regenval de productiviteit van gewassen op verschillende manieren beïnvloeden, waaronder directe fysieke schade, vertraagd planten en oogsten, beperkte wortelgroei, zuurstoftekort en verlies van voedingsstoffen. Zo kan te veel regen net zo gevaarlijk zijn als droogte voor de landbouw:"Gegevens van de afgelopen drie decennia suggereren dat overmatige regenval de gewasopbrengst evenzeer kan beïnvloeden als extreme hitte en droogte. In een nieuwe studie heeft een interdisciplinair team van de De Universiteit van Illinois koppelde gegevens over de oogstverzekering, het klimaat, de bodem en de maïsopbrengst van 1981 tot 2016. Uit het onderzoek bleek dat overmatige regenval gedurende enkele jaren de Amerikaanse maïsopbrengst met maar liefst 34% verminderde ten opzichte van de verwachte opbrengst. droogte en extreme hitte zorgden in enkele jaren voor een opbrengstverlies tot 37% [2]" .
Helaas zijn vroegtijdige waarschuwingssystemen niet voldoende om verergerende effecten van overmatige regenval op landbouwproducten en -processen volledig te voorkomen zonder adequate en voorlopige lokale weergegevens voor elke kas of boerderij. Daarom heb ik, in de hoop de nadelige effecten van overmatige regenval op de landbouw te voorkomen, besloten om dit project te creëren als een budgetvriendelijk extern weerstation om lokale weersinformatie te verzamelen en te interpreteren om nauwkeurigere voorspellingen te doen over de neerslagintensiteit.
Na wat onderzoek te hebben gedaan naar deep learning en neurale netwerken, besloot ik een kunstmatig neuraal netwerk (ANN) te bouwen op basis van het classificatiemodel om de verzamelde lokale weergegevens te interpreteren om de regenvalintensiteit te voorspellen volgens de gegeven klassen. Zoals de volgende studie aangeeft, hebben onderzoekers verschillende neurale netwerkmodellen en -types toegepast om niet alleen regenval, maar ook weersverschijnselen te voorspellen:"Veel experimenten hebben neurale netwerken gebruikt om kwantitatieve neerslaghoeveelheden op verschillende locaties en vooruitziende reeksen te voorspellen. onderzoekers in Thailand waren bijvoorbeeld in staat om zeer nauwkeurige voorspellingen te verkrijgen met behulp van feed-forward neurale netwerken om kwantitatieve neerslaghoeveelheden te voorspellen in het vooruitziende bereik van één tot drie uur om mogelijke overstromingsgevaren te voorspellen. weersverschijnselen naast de traditionele voorspellingswaarden, zoals waarschijnlijkheid/hoeveelheid regen, windsnelheid, luchtdruk, enz. Ze zijn zeer succesvol gebruikt om tornado's te voorspellen.Bovendien hebben onderzoekers in Australië met succes een neuraal netwerk gebruikt om mist te identificeren bij verschillende voorspellingen varieert van 3 uur tot 18 uur rond Canberra International Airport [3]."
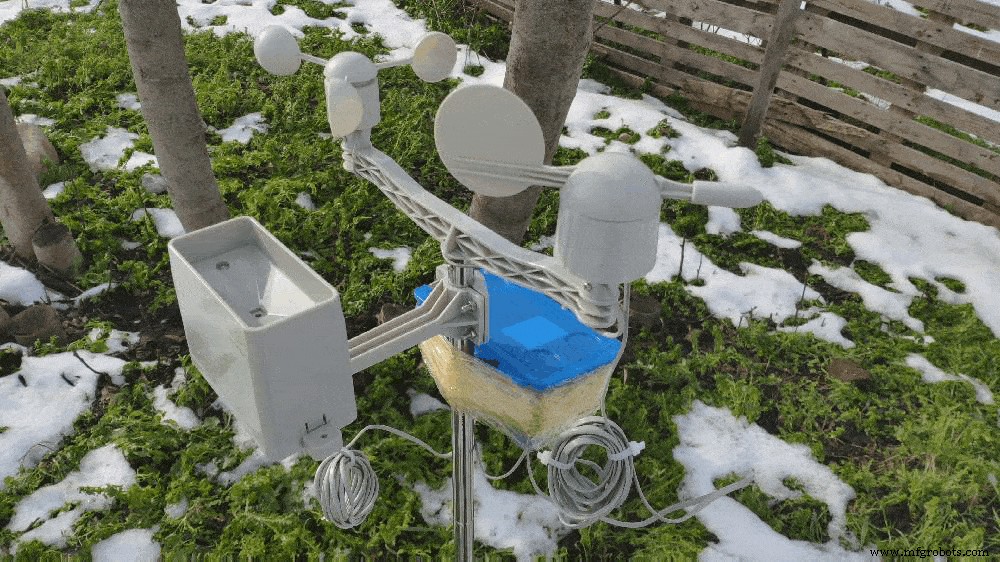
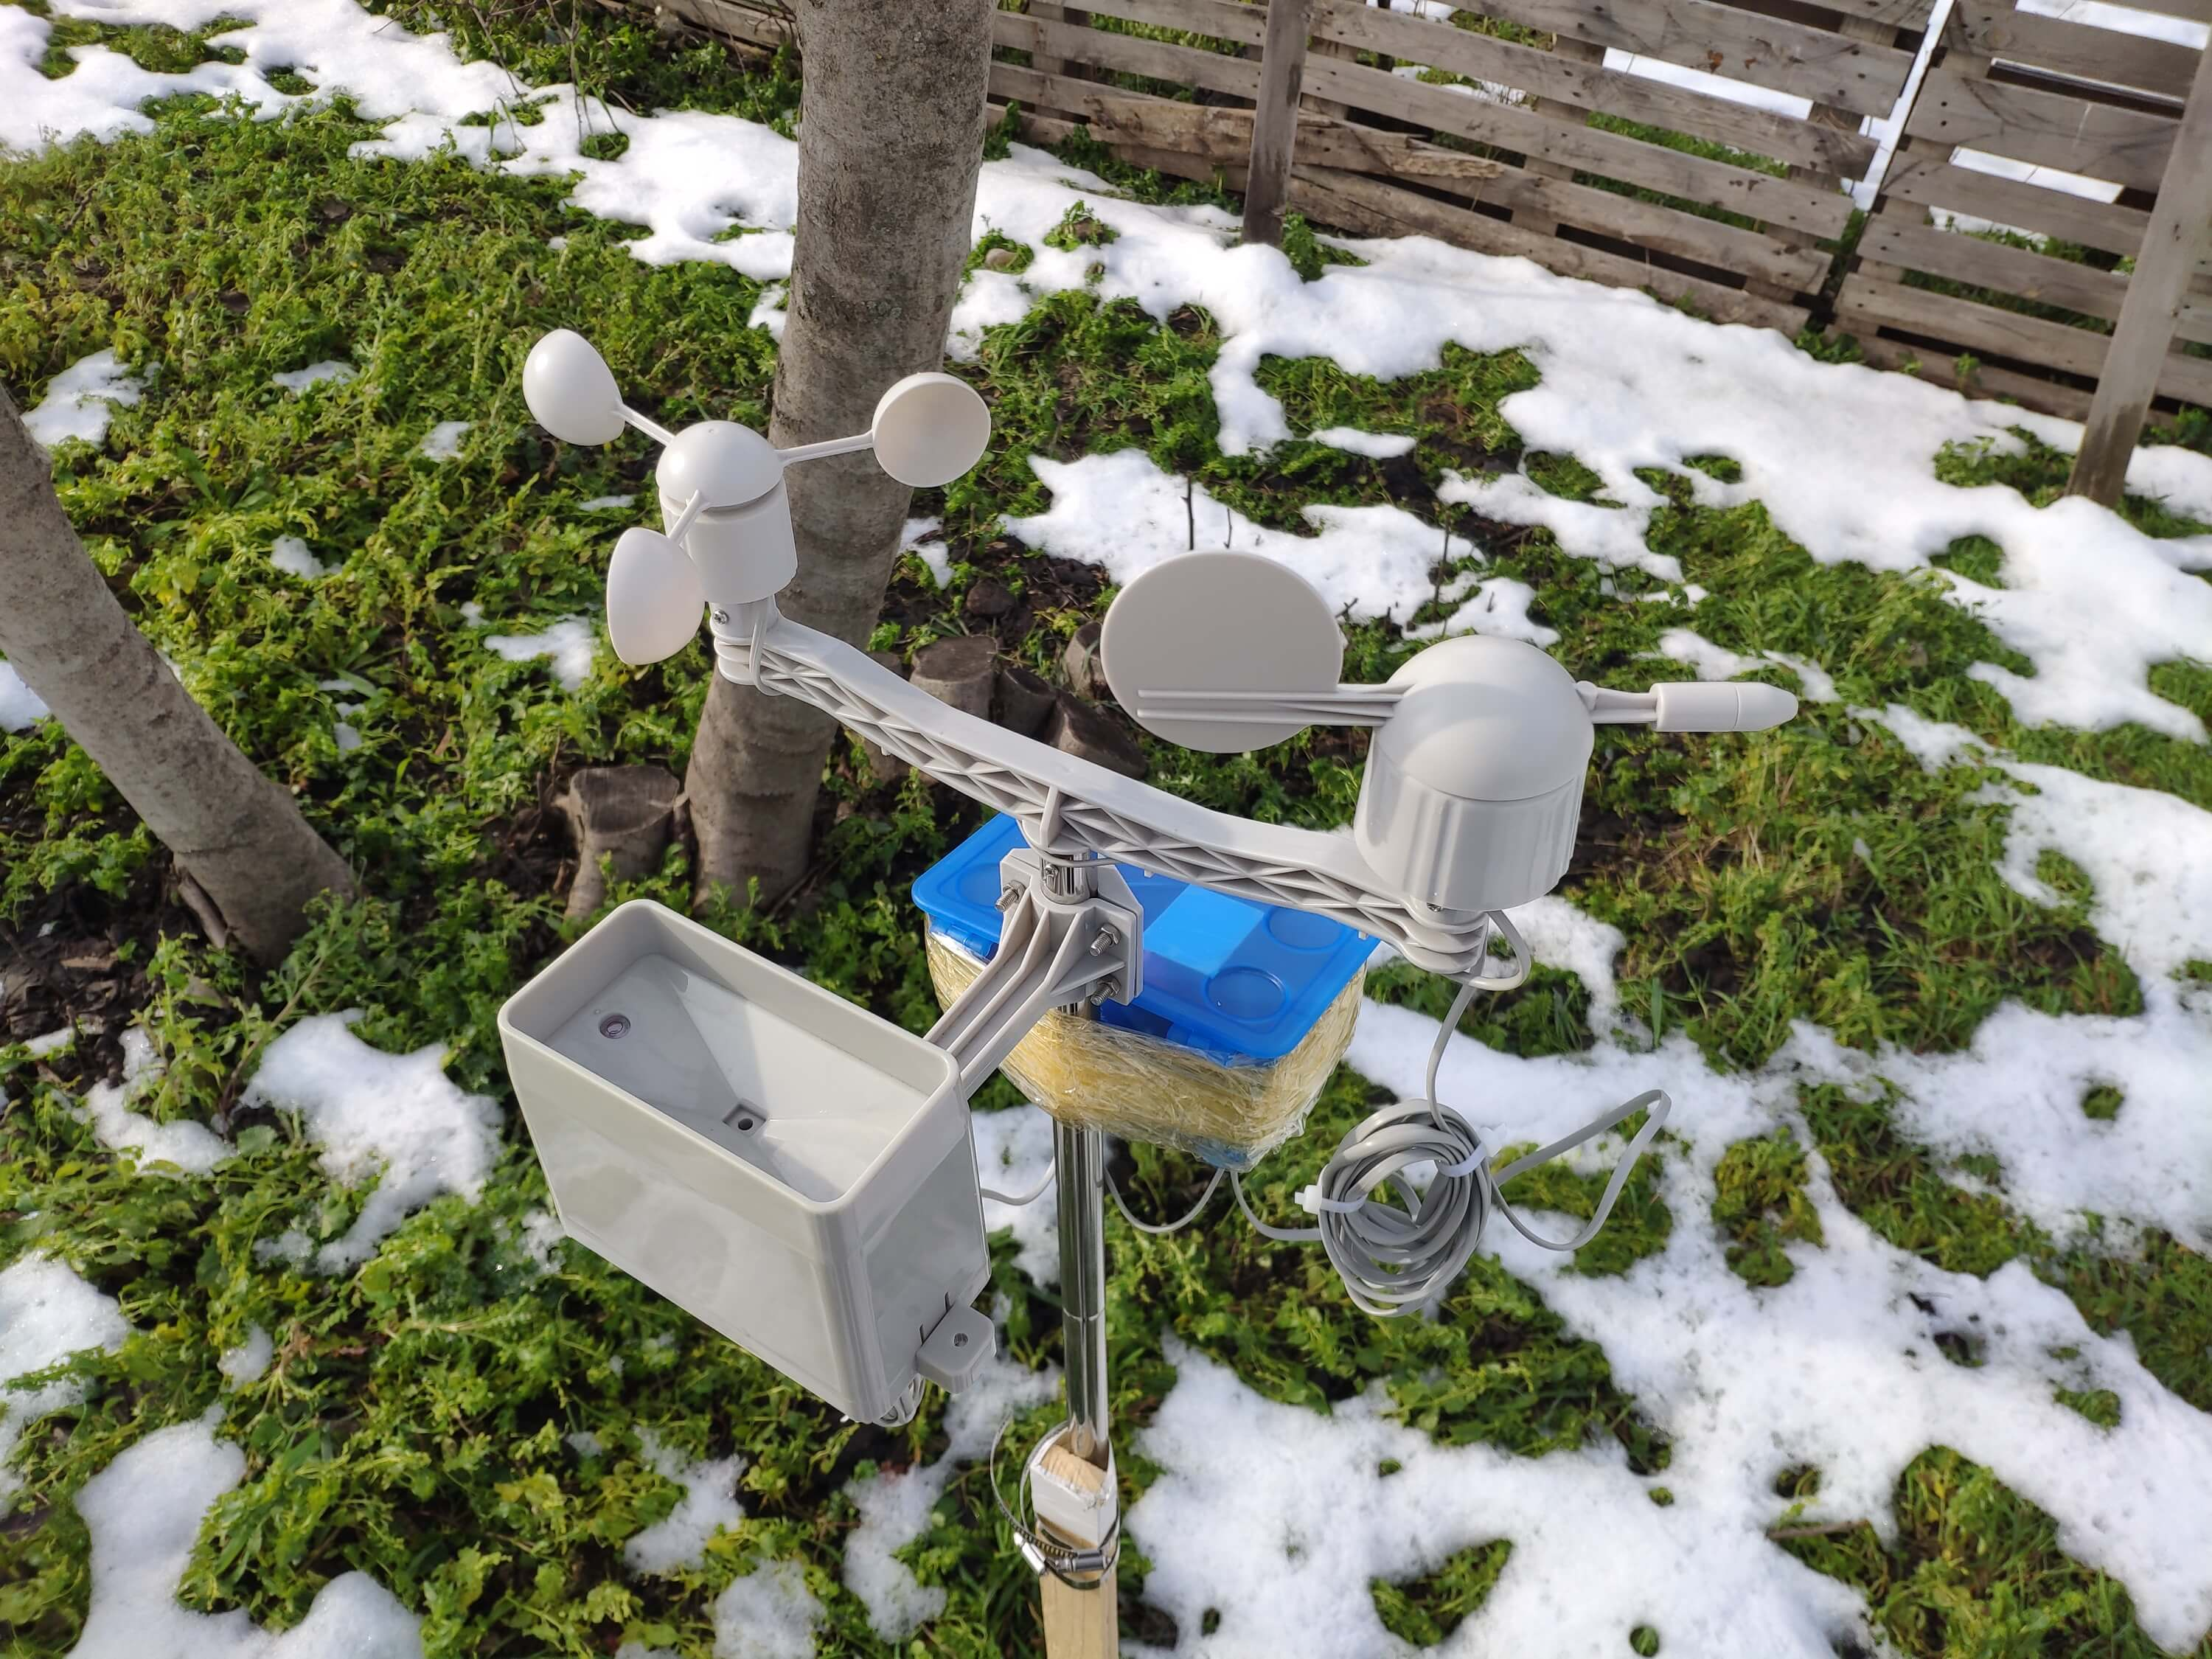
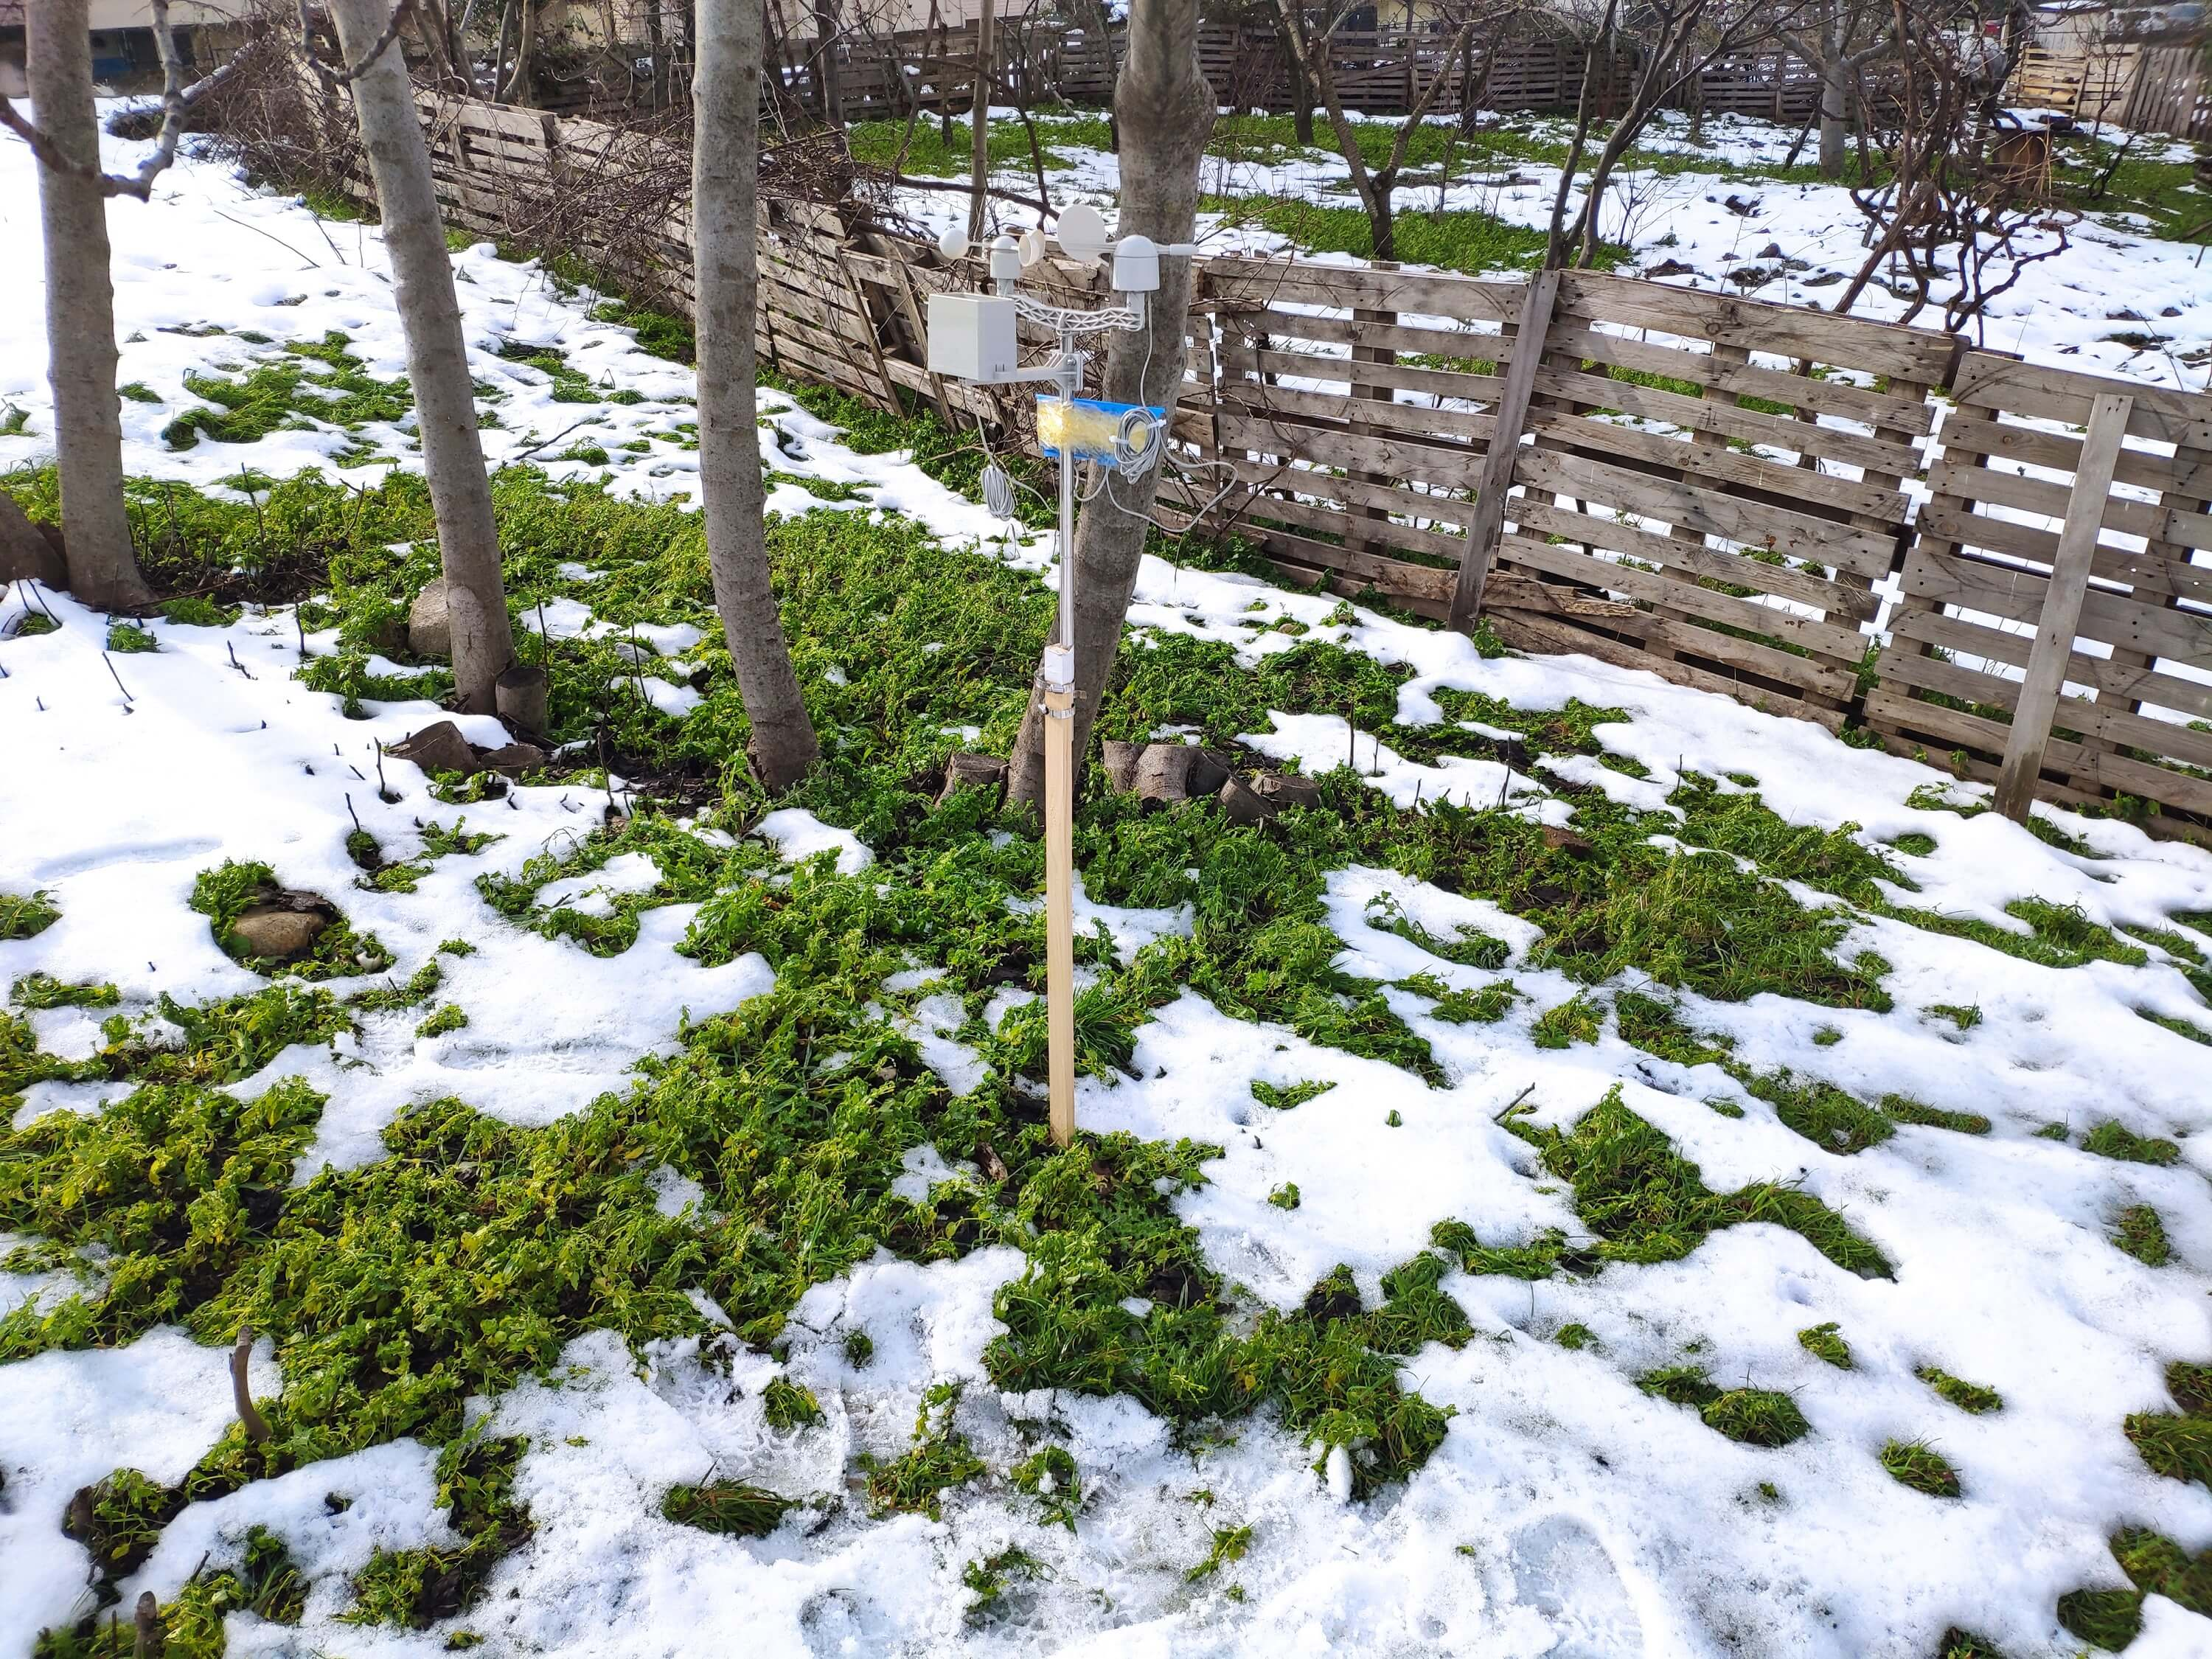
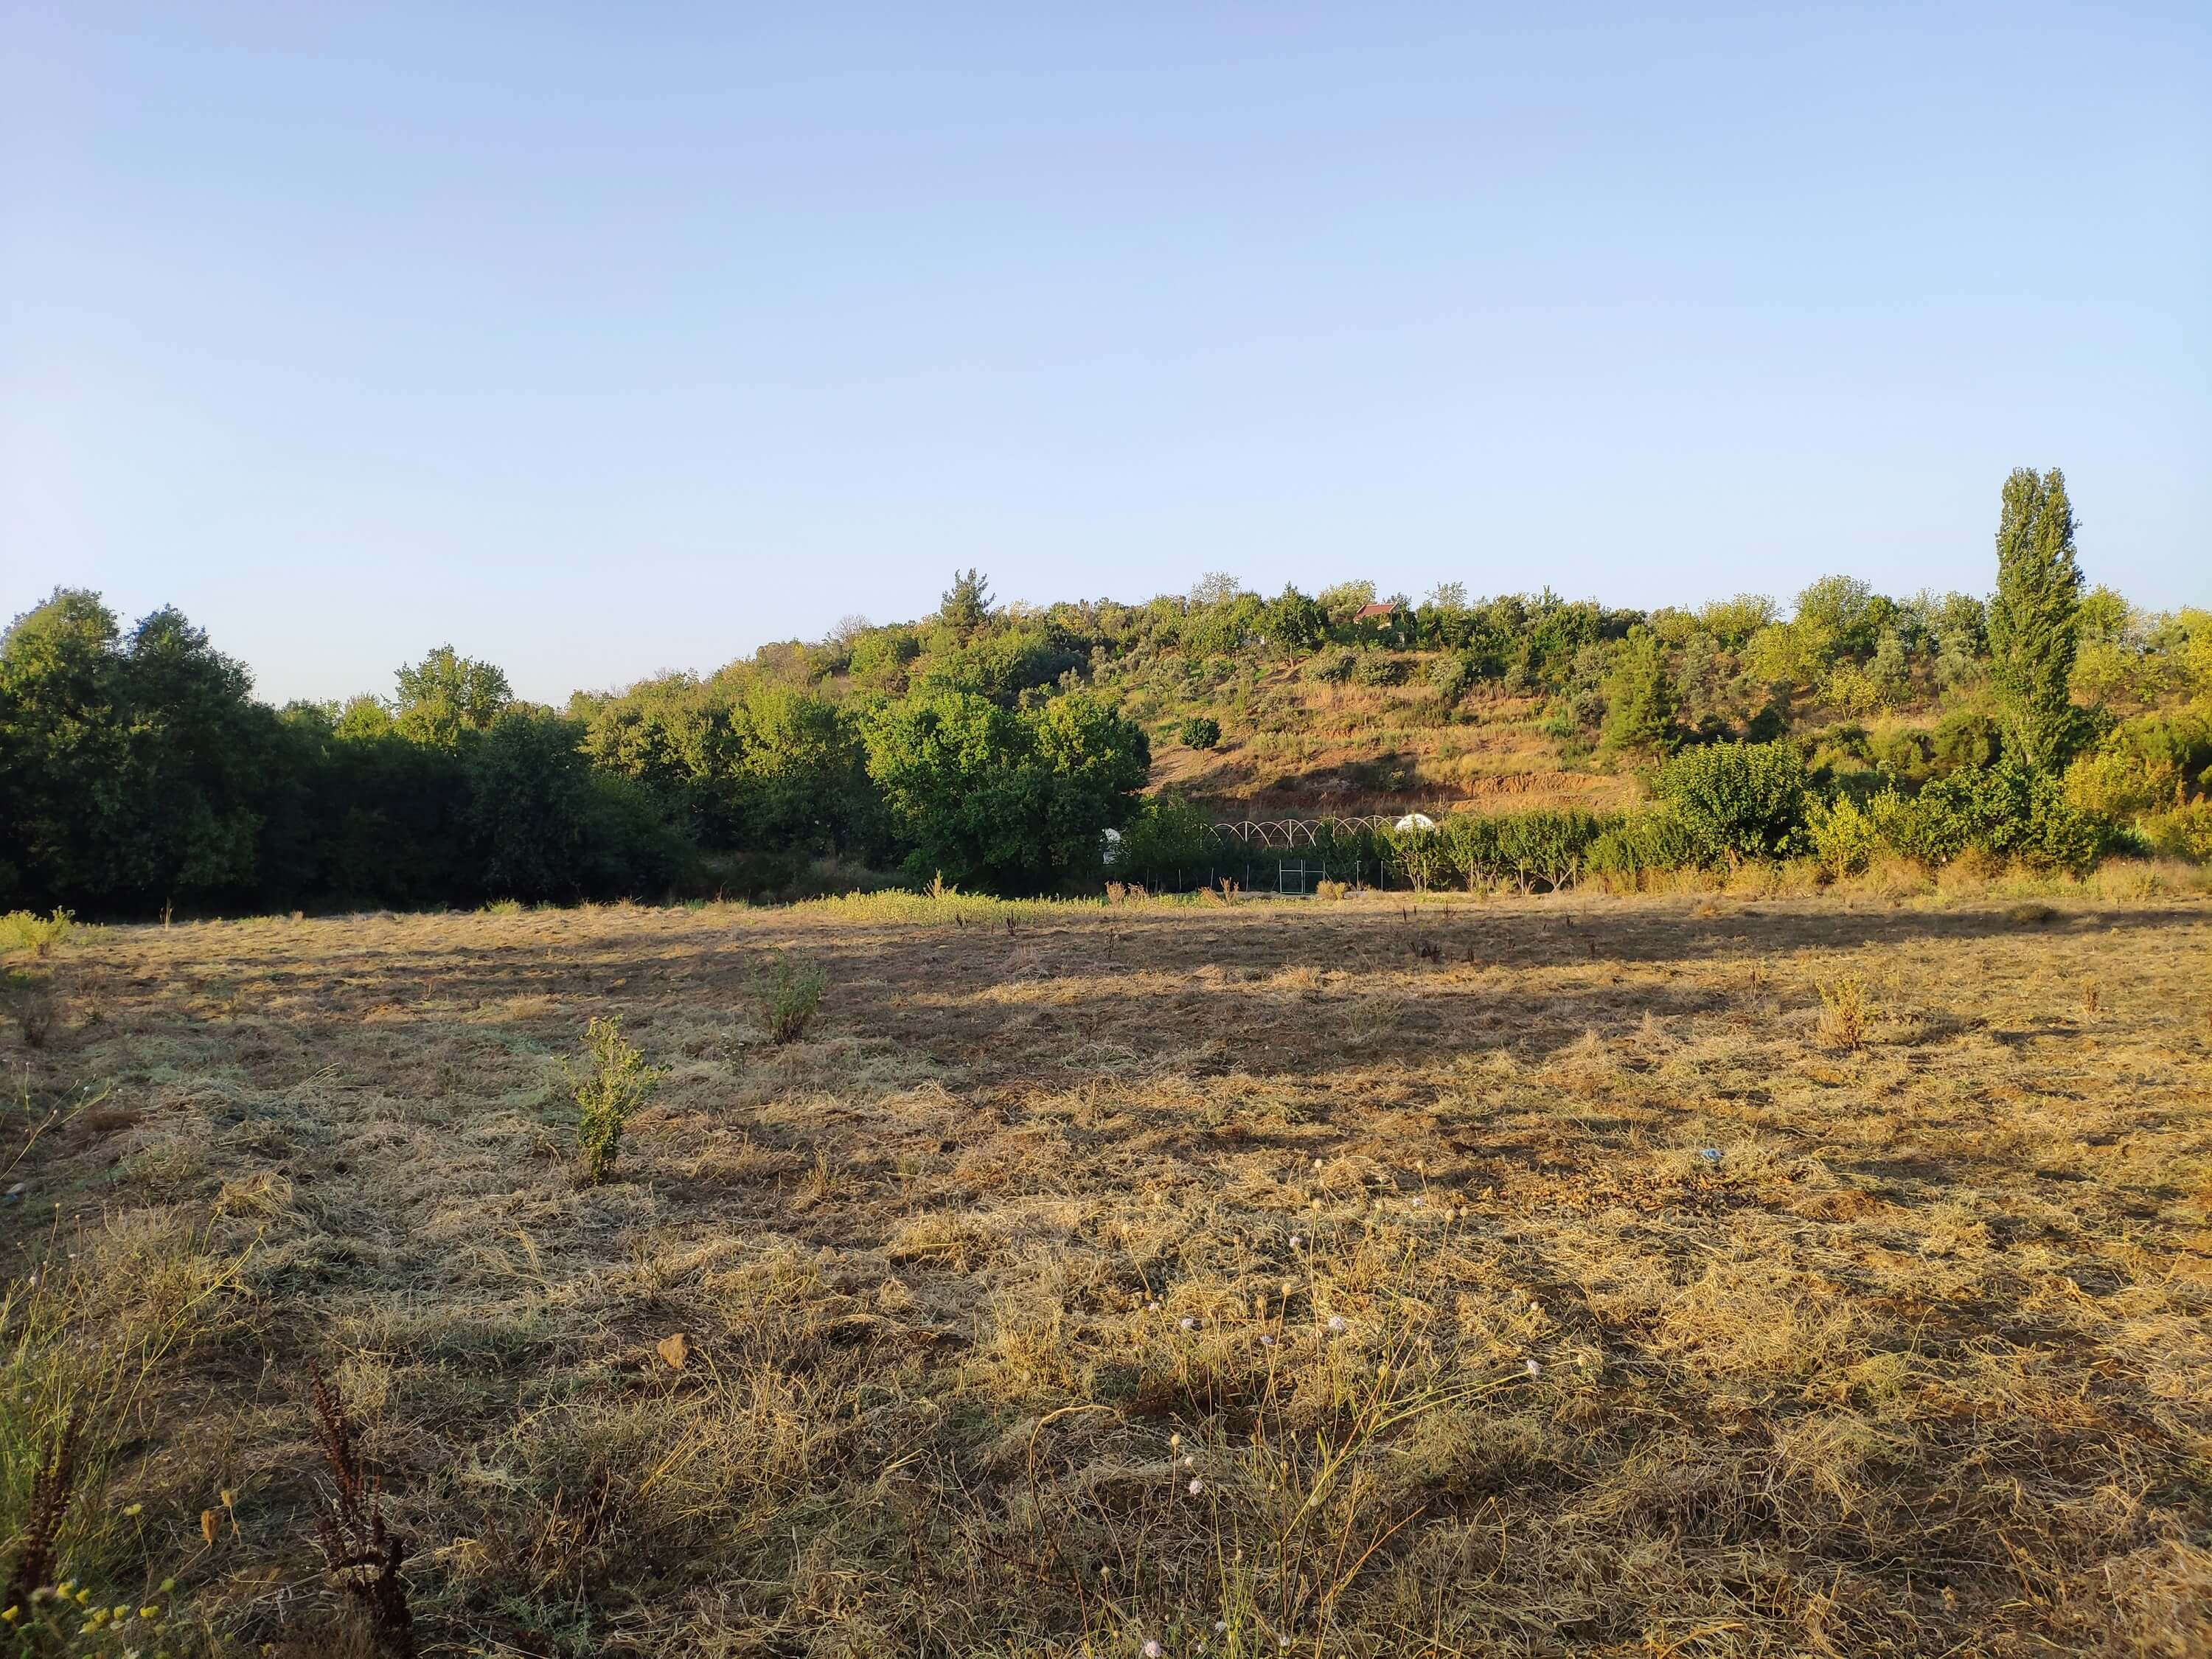
Voordat ik mijn neurale netwerkmodel bouwde en testte, had ik gedurende meer dan drie maanden weergegevens verzameld op mijn balkon en achtertuin in een straal van drie kilometer om een lokale weergegevensset te maken met weersinformatie in mijn buurt. Om zelfs in extreme weersomstandigheden weersinformatie te kunnen oproepen, heb ik een weerstationkit met windmeter, windvaan en regenemmer van DFRobot gebruikt met twee verschillende ontwikkelborden:
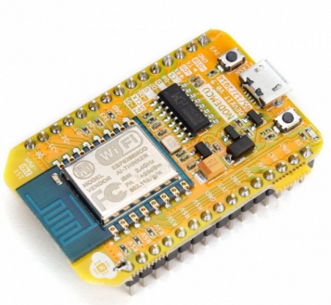
- NodeMCU ESP-12E (WiFi-ingeschakeld)
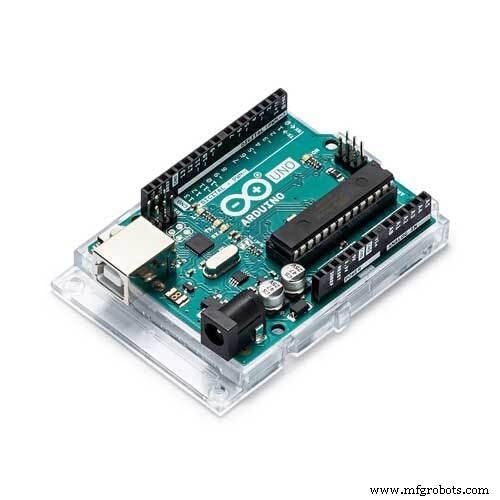
- Arduino Uno + DFRobot SIM808 GPS/GPRS/GSM Shield (GPRS-enabled)
Zo kon ik weergegevens overdragen via wifi op mijn balkon of GPRS als de afstand tussen mijn router en het weerstation te ver weg is.
Ik besloot om Google Spreadsheets, een cloudgebaseerd spreadsheetprogramma, te gebruiken om weergegevens te verzamelen die door het weerstation zijn gegenereerd, omdat het maken van grote datasets en het toevoegen van nieuwe informatie eenvoudig is met de Google Spreadsheets API. Daarom heb ik een webtoepassing in PHP ontwikkeld om weergegevens te verkrijgen die door de ontwikkelingsborden zijn overgedragen en deze toe te voegen aan een spreadsheet op Google Spreadsheets.
Na het verzamelen van weergegevens gedurende meer dan drie maanden om de vijf minuten, bouwde ik een kunstmatig neuraal netwerk (ANN) -model met TensorFlow om voorspellingen te doen over de regenvalintensiteit. Theoretisch heb ik een regenvalintensiteitsklasse toegewezen voor elke meting na het schalen en normaliseren van de dataset. Vervolgens heb ik het neurale netwerkmodel getraind om deze klassen te classificeren:
- Geen regen
- Lichte regenval
- Matige regenval
- Zware regenval
- Gewelddadige regenval
Dit is dus mijn project in een notendop 😃
In de volgende stappen vindt u meer gedetailleerde informatie over codering, het verzamelen van lokale weergegevens en het bouwen van een model van een artificieel neuraal netwerk (ANN) met TensorFlow.
Grote dank aan DFRobot voor het sponsoren van dit project.
Gesponsorde producten door DFRobot:
⭐ Weerstationkit met windmeter/windvaan/regenemmer | Inspecteren
⭐ SIM808 GPS/GPRS/GSM-schild voor Arduino | Inspecteren
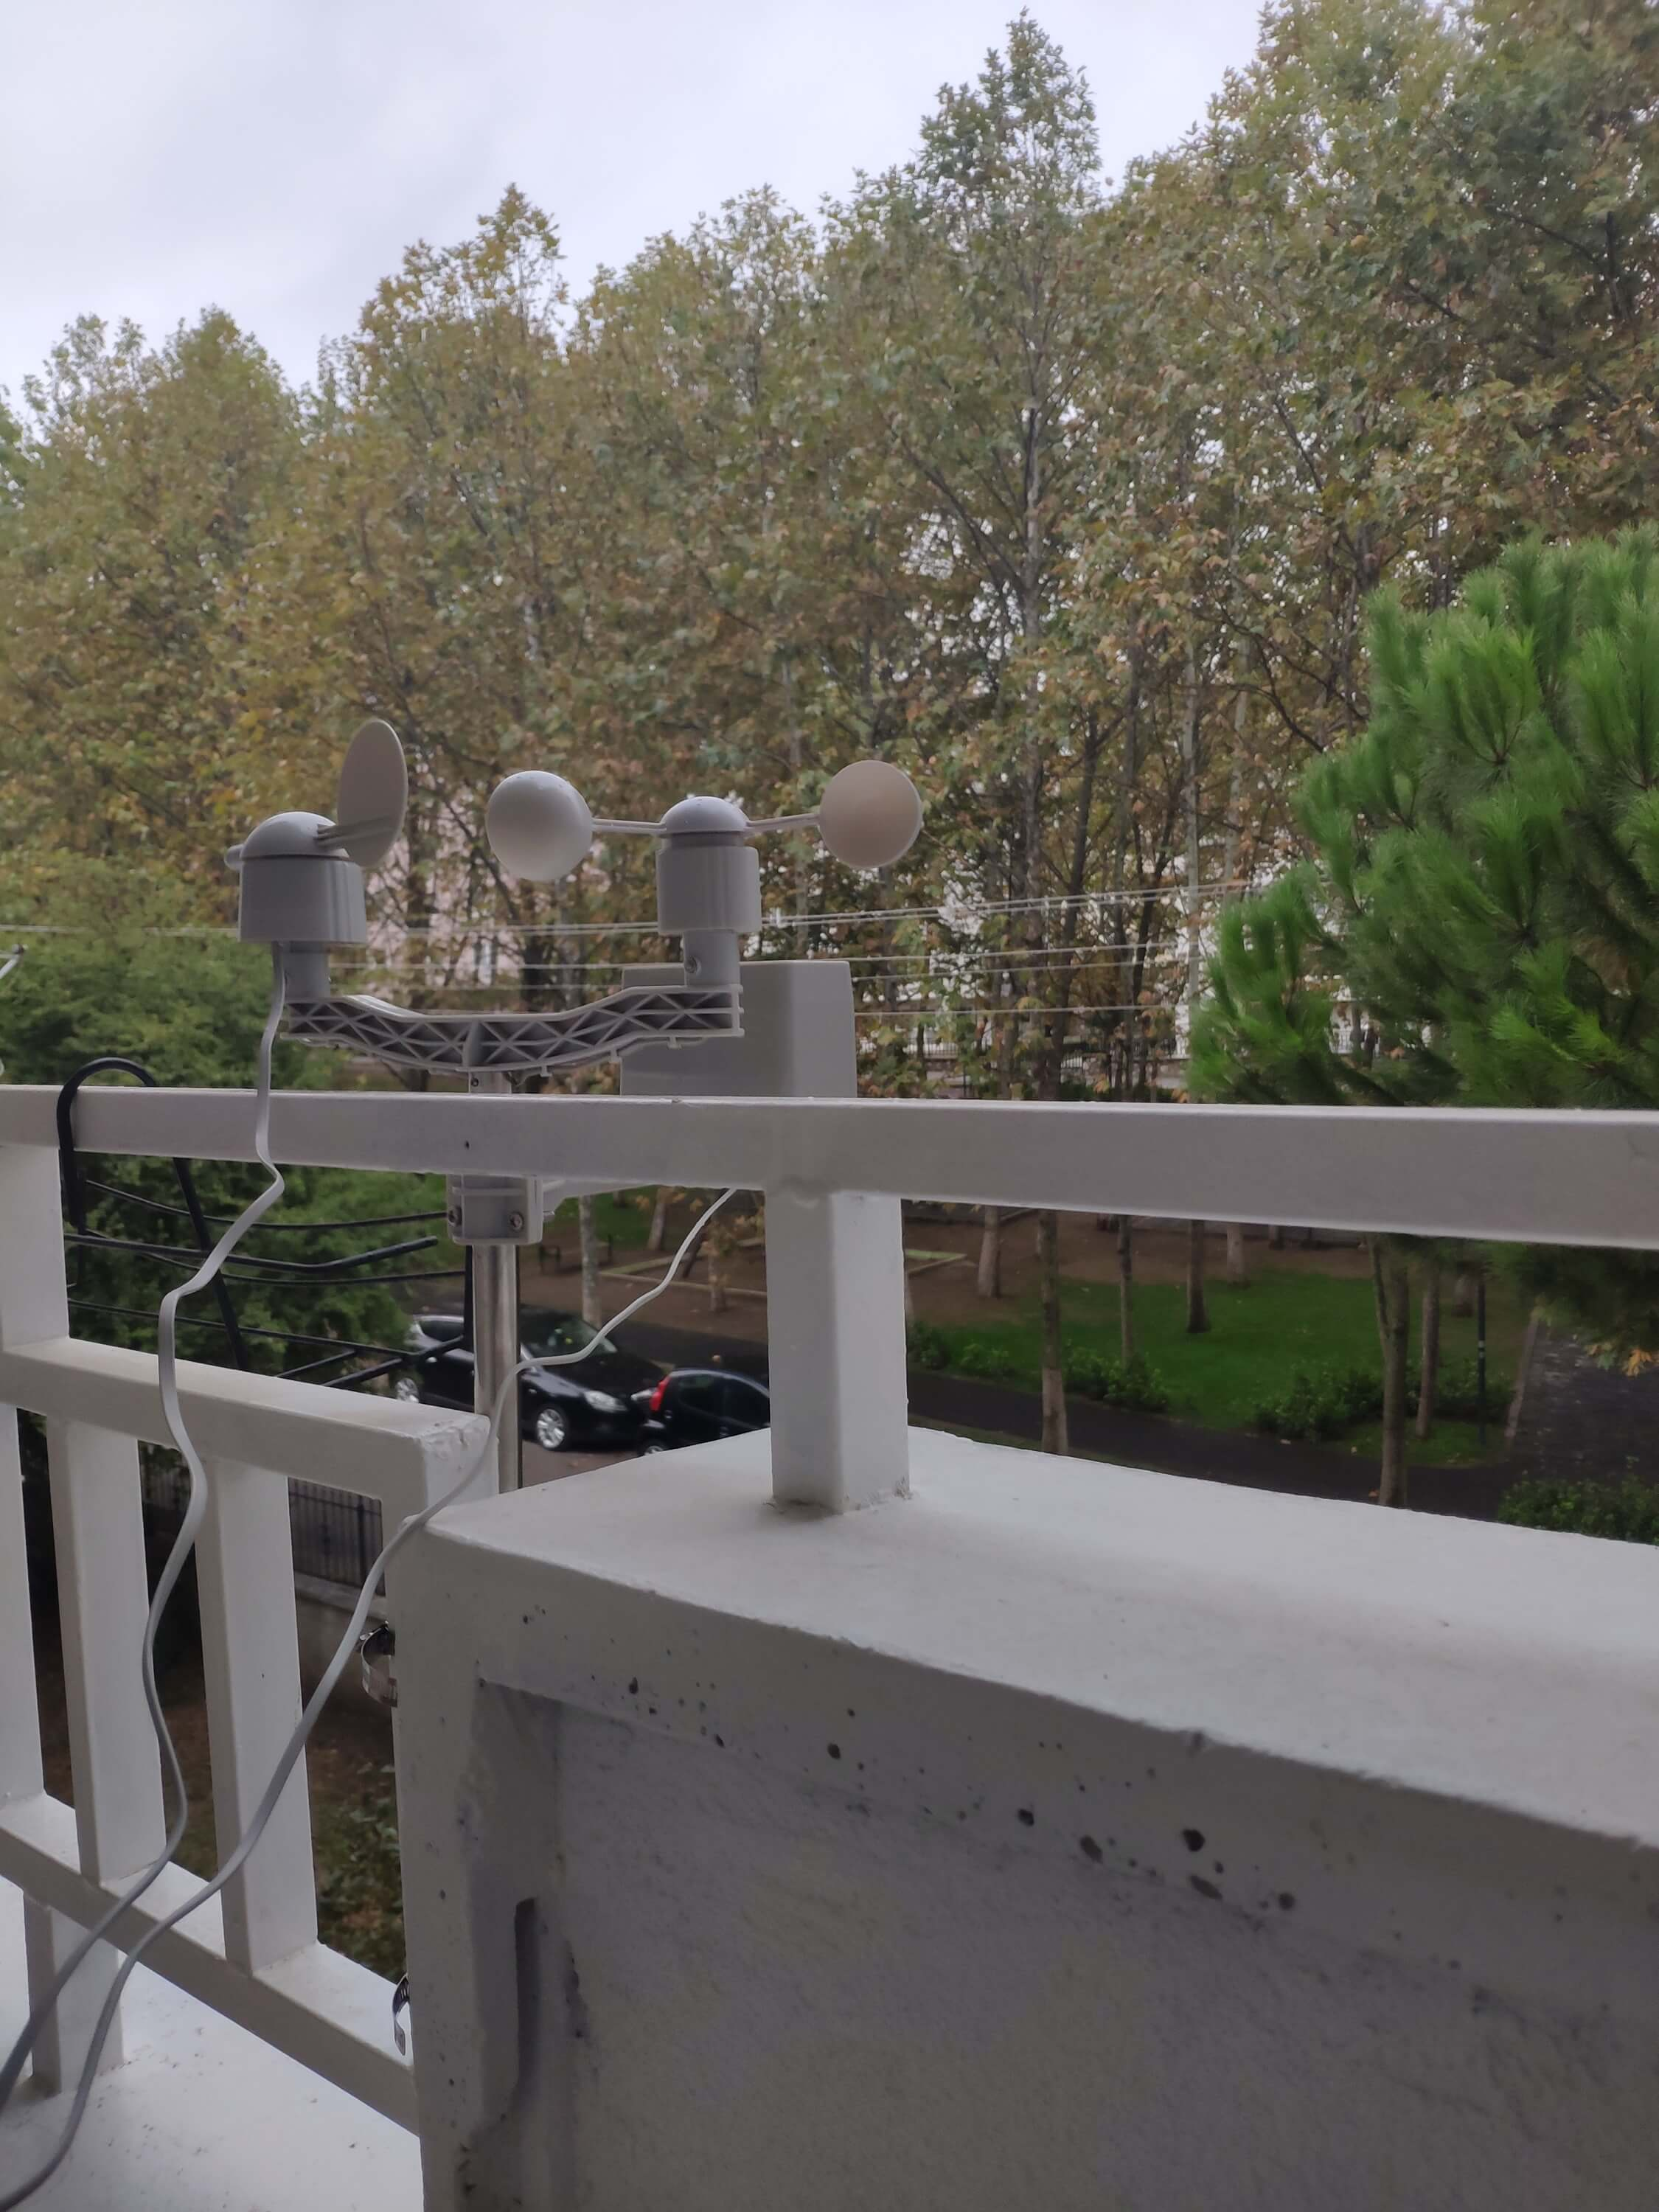
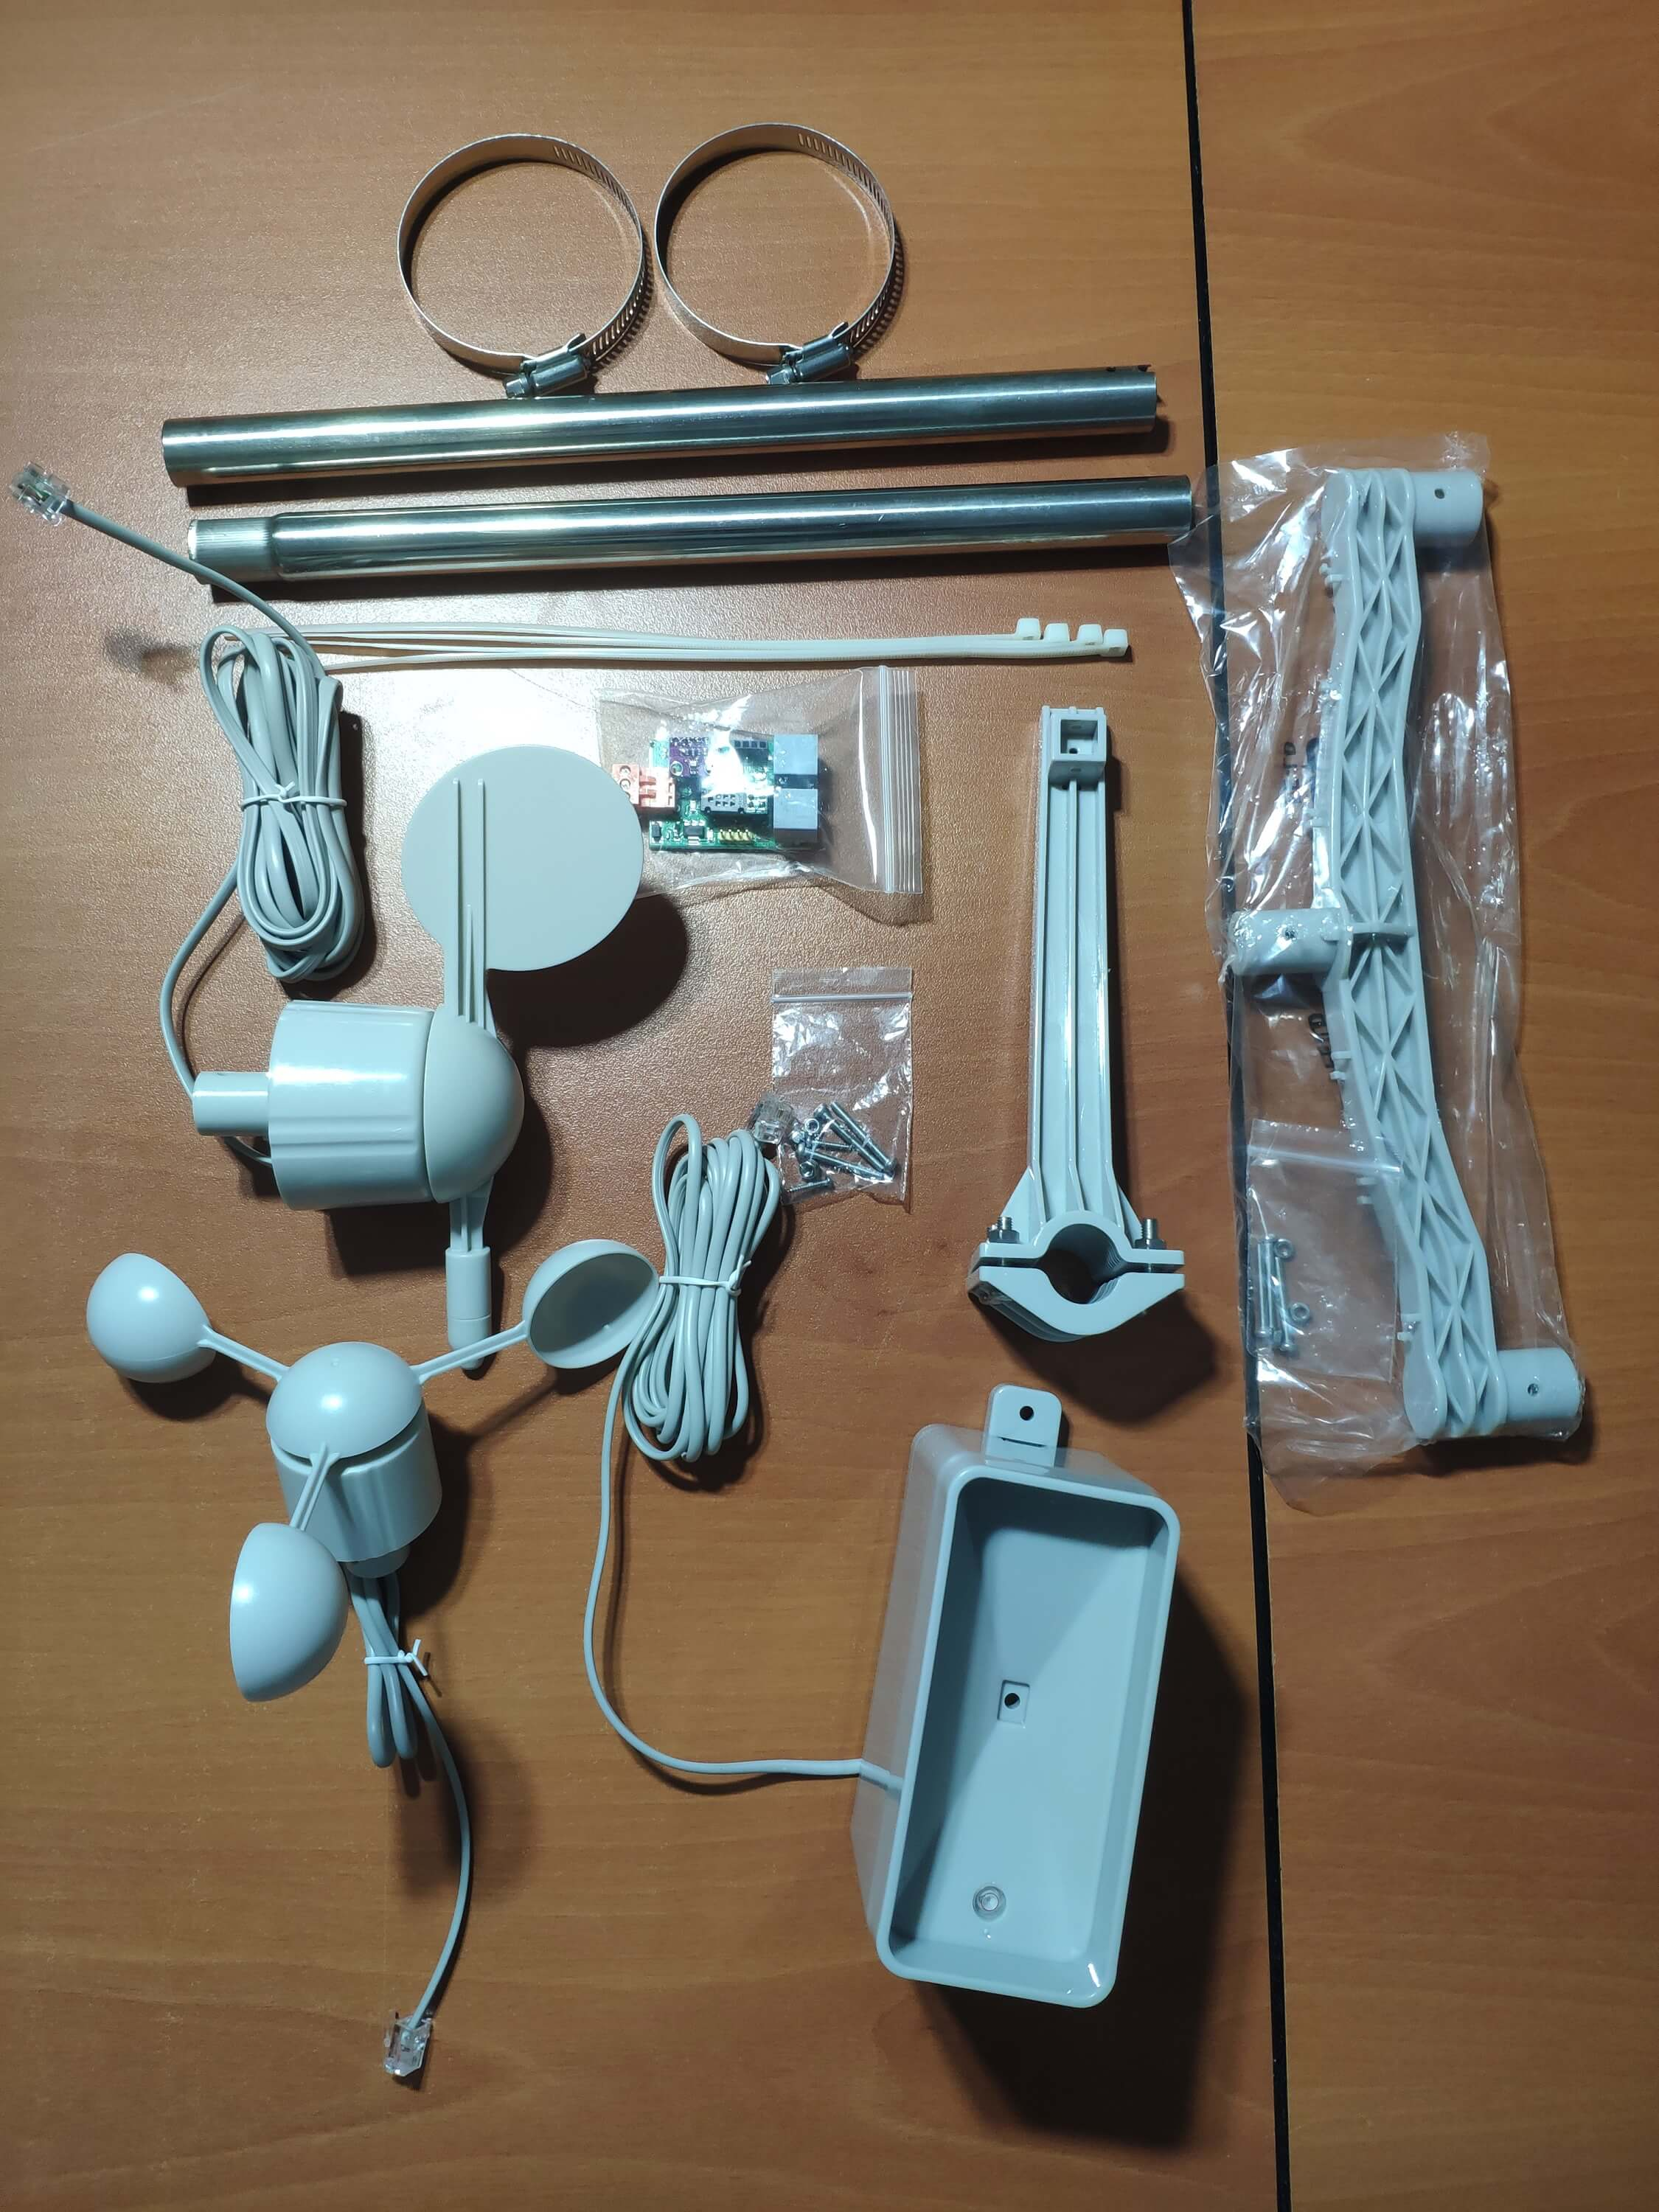
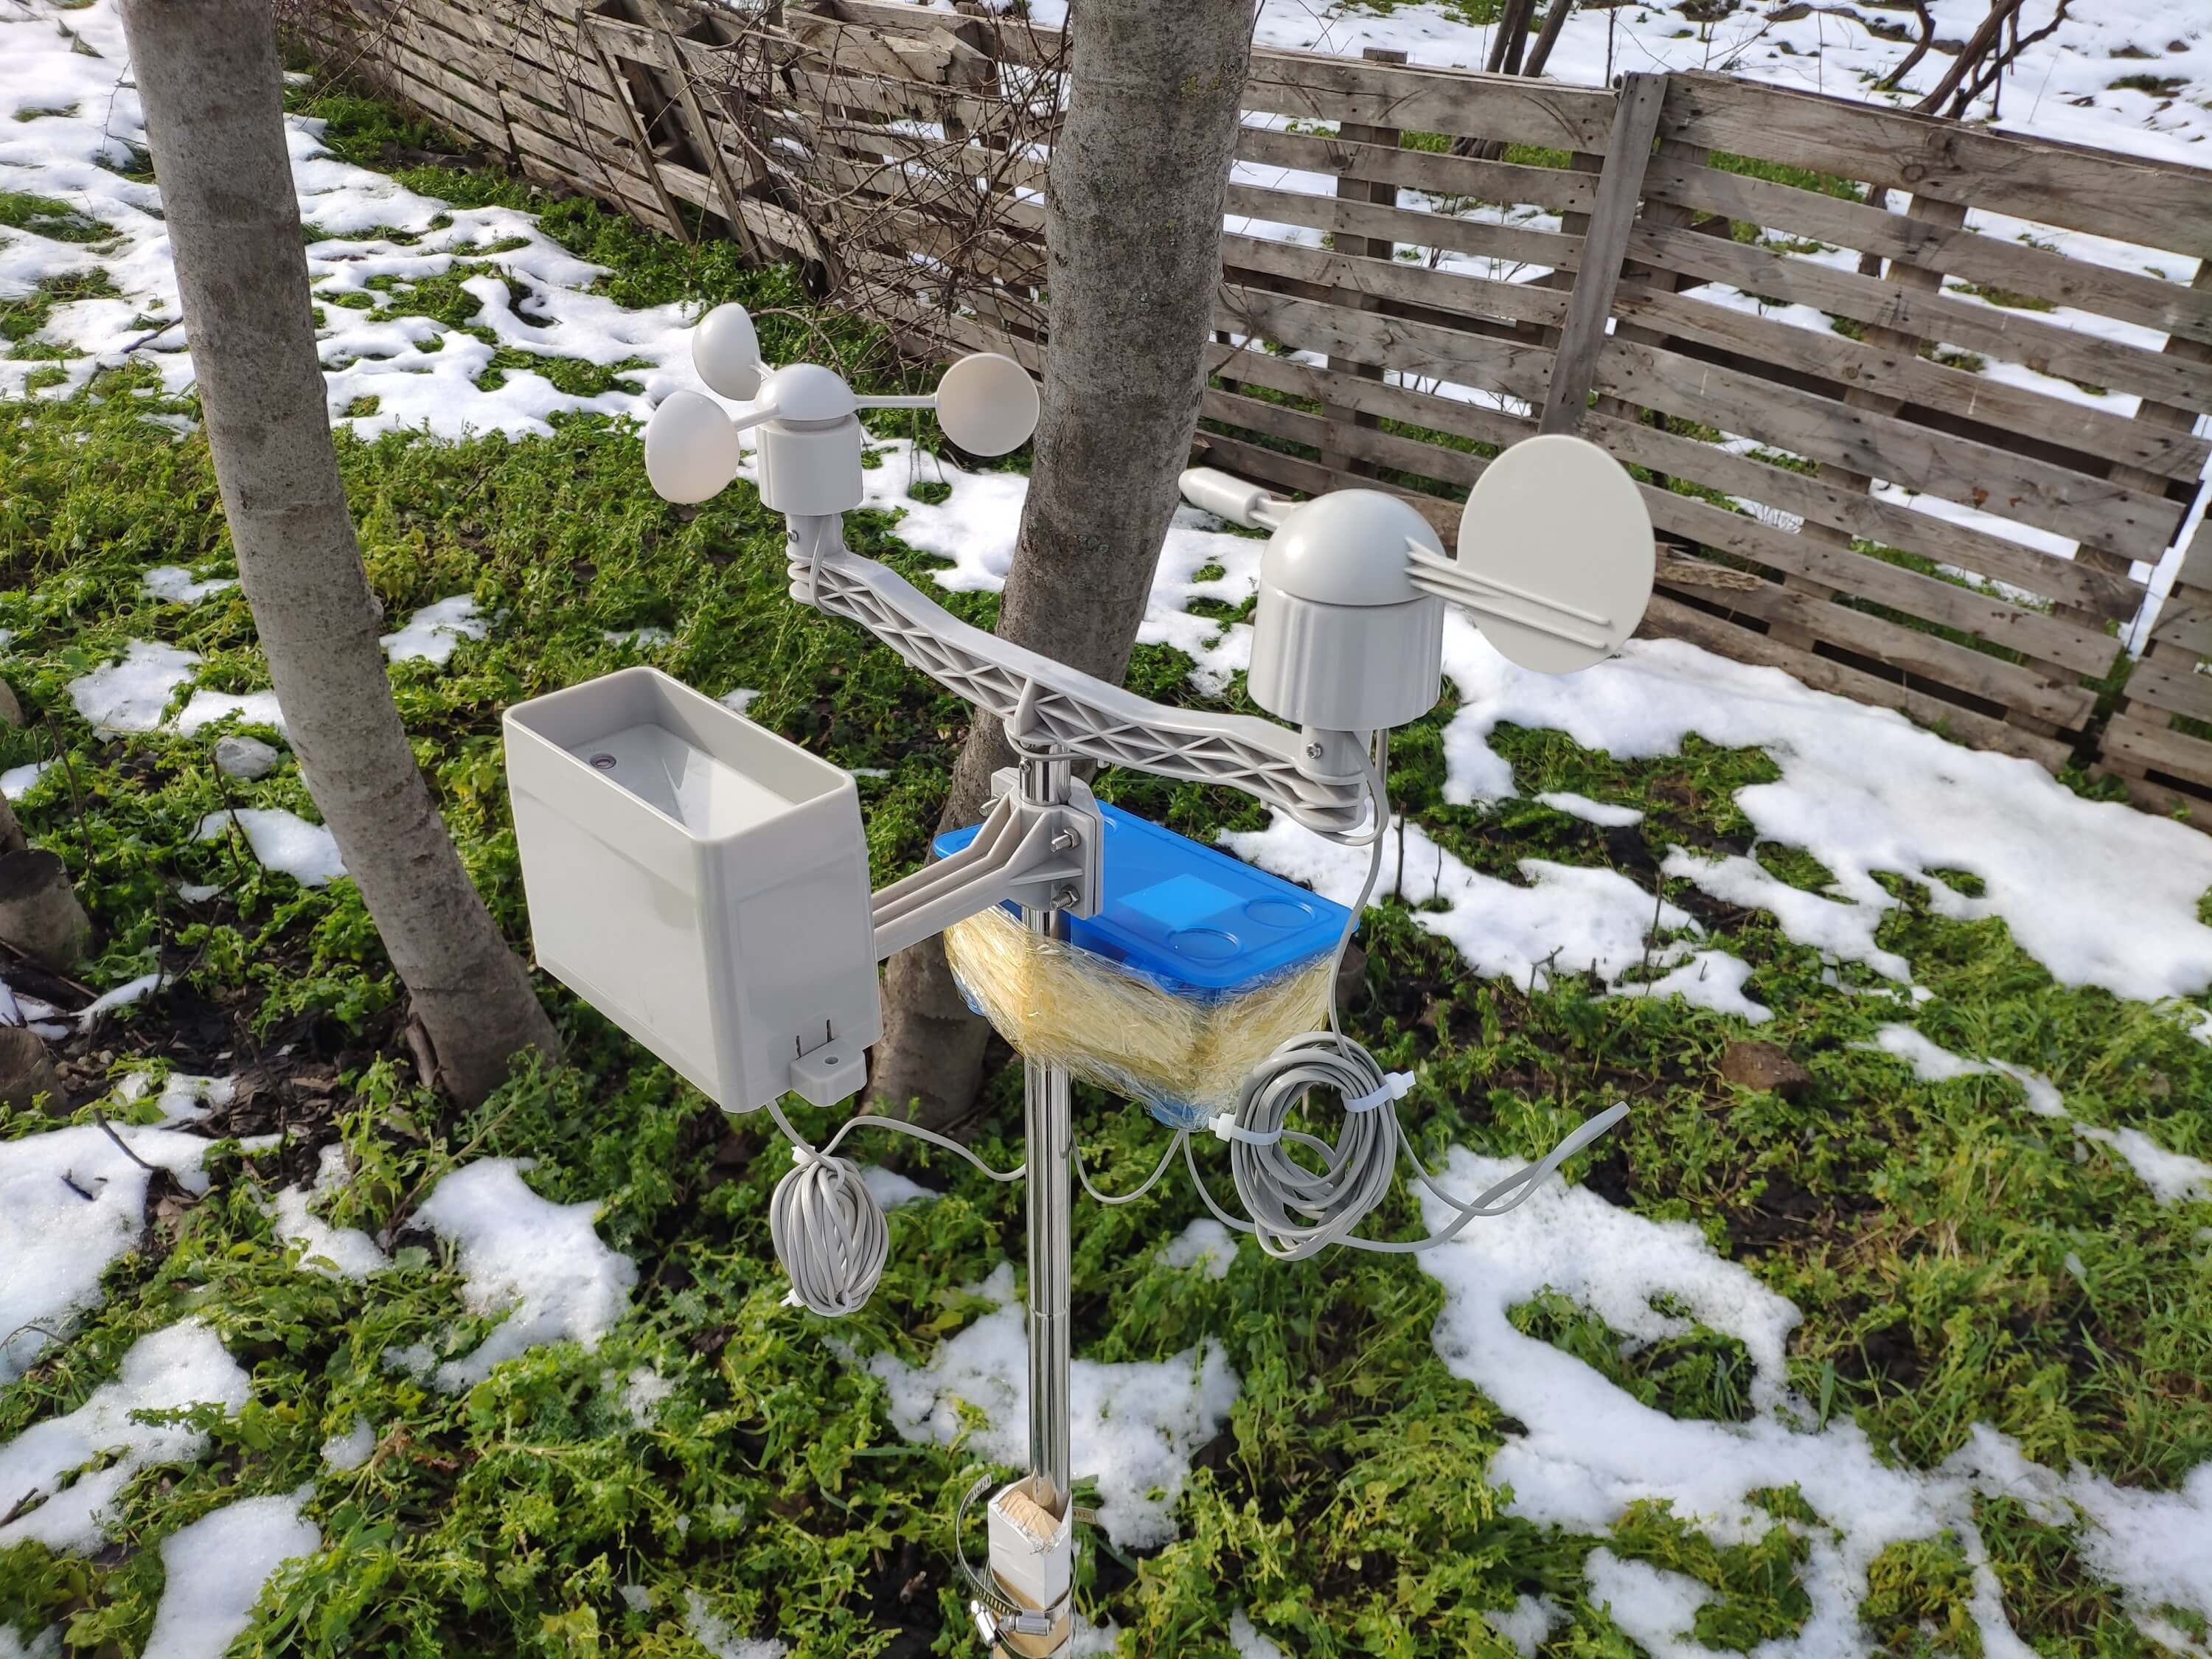
Stap 1:Montage van de weerstationkit met windmeter, windvaan en regenemmer
Deze weerstationkit bevat een anemometer, windrank, regenemmer en een sensorbord om weergegevens te verzenden via het seriële communicatieprotocol. Het is dus gemakkelijk te gebruiken met ontwikkelingsborden om lokale weergegevens te verzamelen.
Het voert 37 bytes per seconde uit, inclusief het einde CR/LF .
c000s000g000t086r000p000h53b10020 Gegevensparser:
- c000 : luchtrichting, graad
- s000 : luchtsnelheid (gemiddeld), 0,1 mijl per uur
- g000 : luchtsnelheid (max), 0,1 mijl per uur
- t086 : temperatuur, Fahrenheit
- r000 : regenval (1 uur), 0,01 inch
- p000 : regenval (24 uur), 0,01 inch
- h53 : vochtigheid, % (00%=100)
- b10020 : atmosfeer, 0,1 hPa
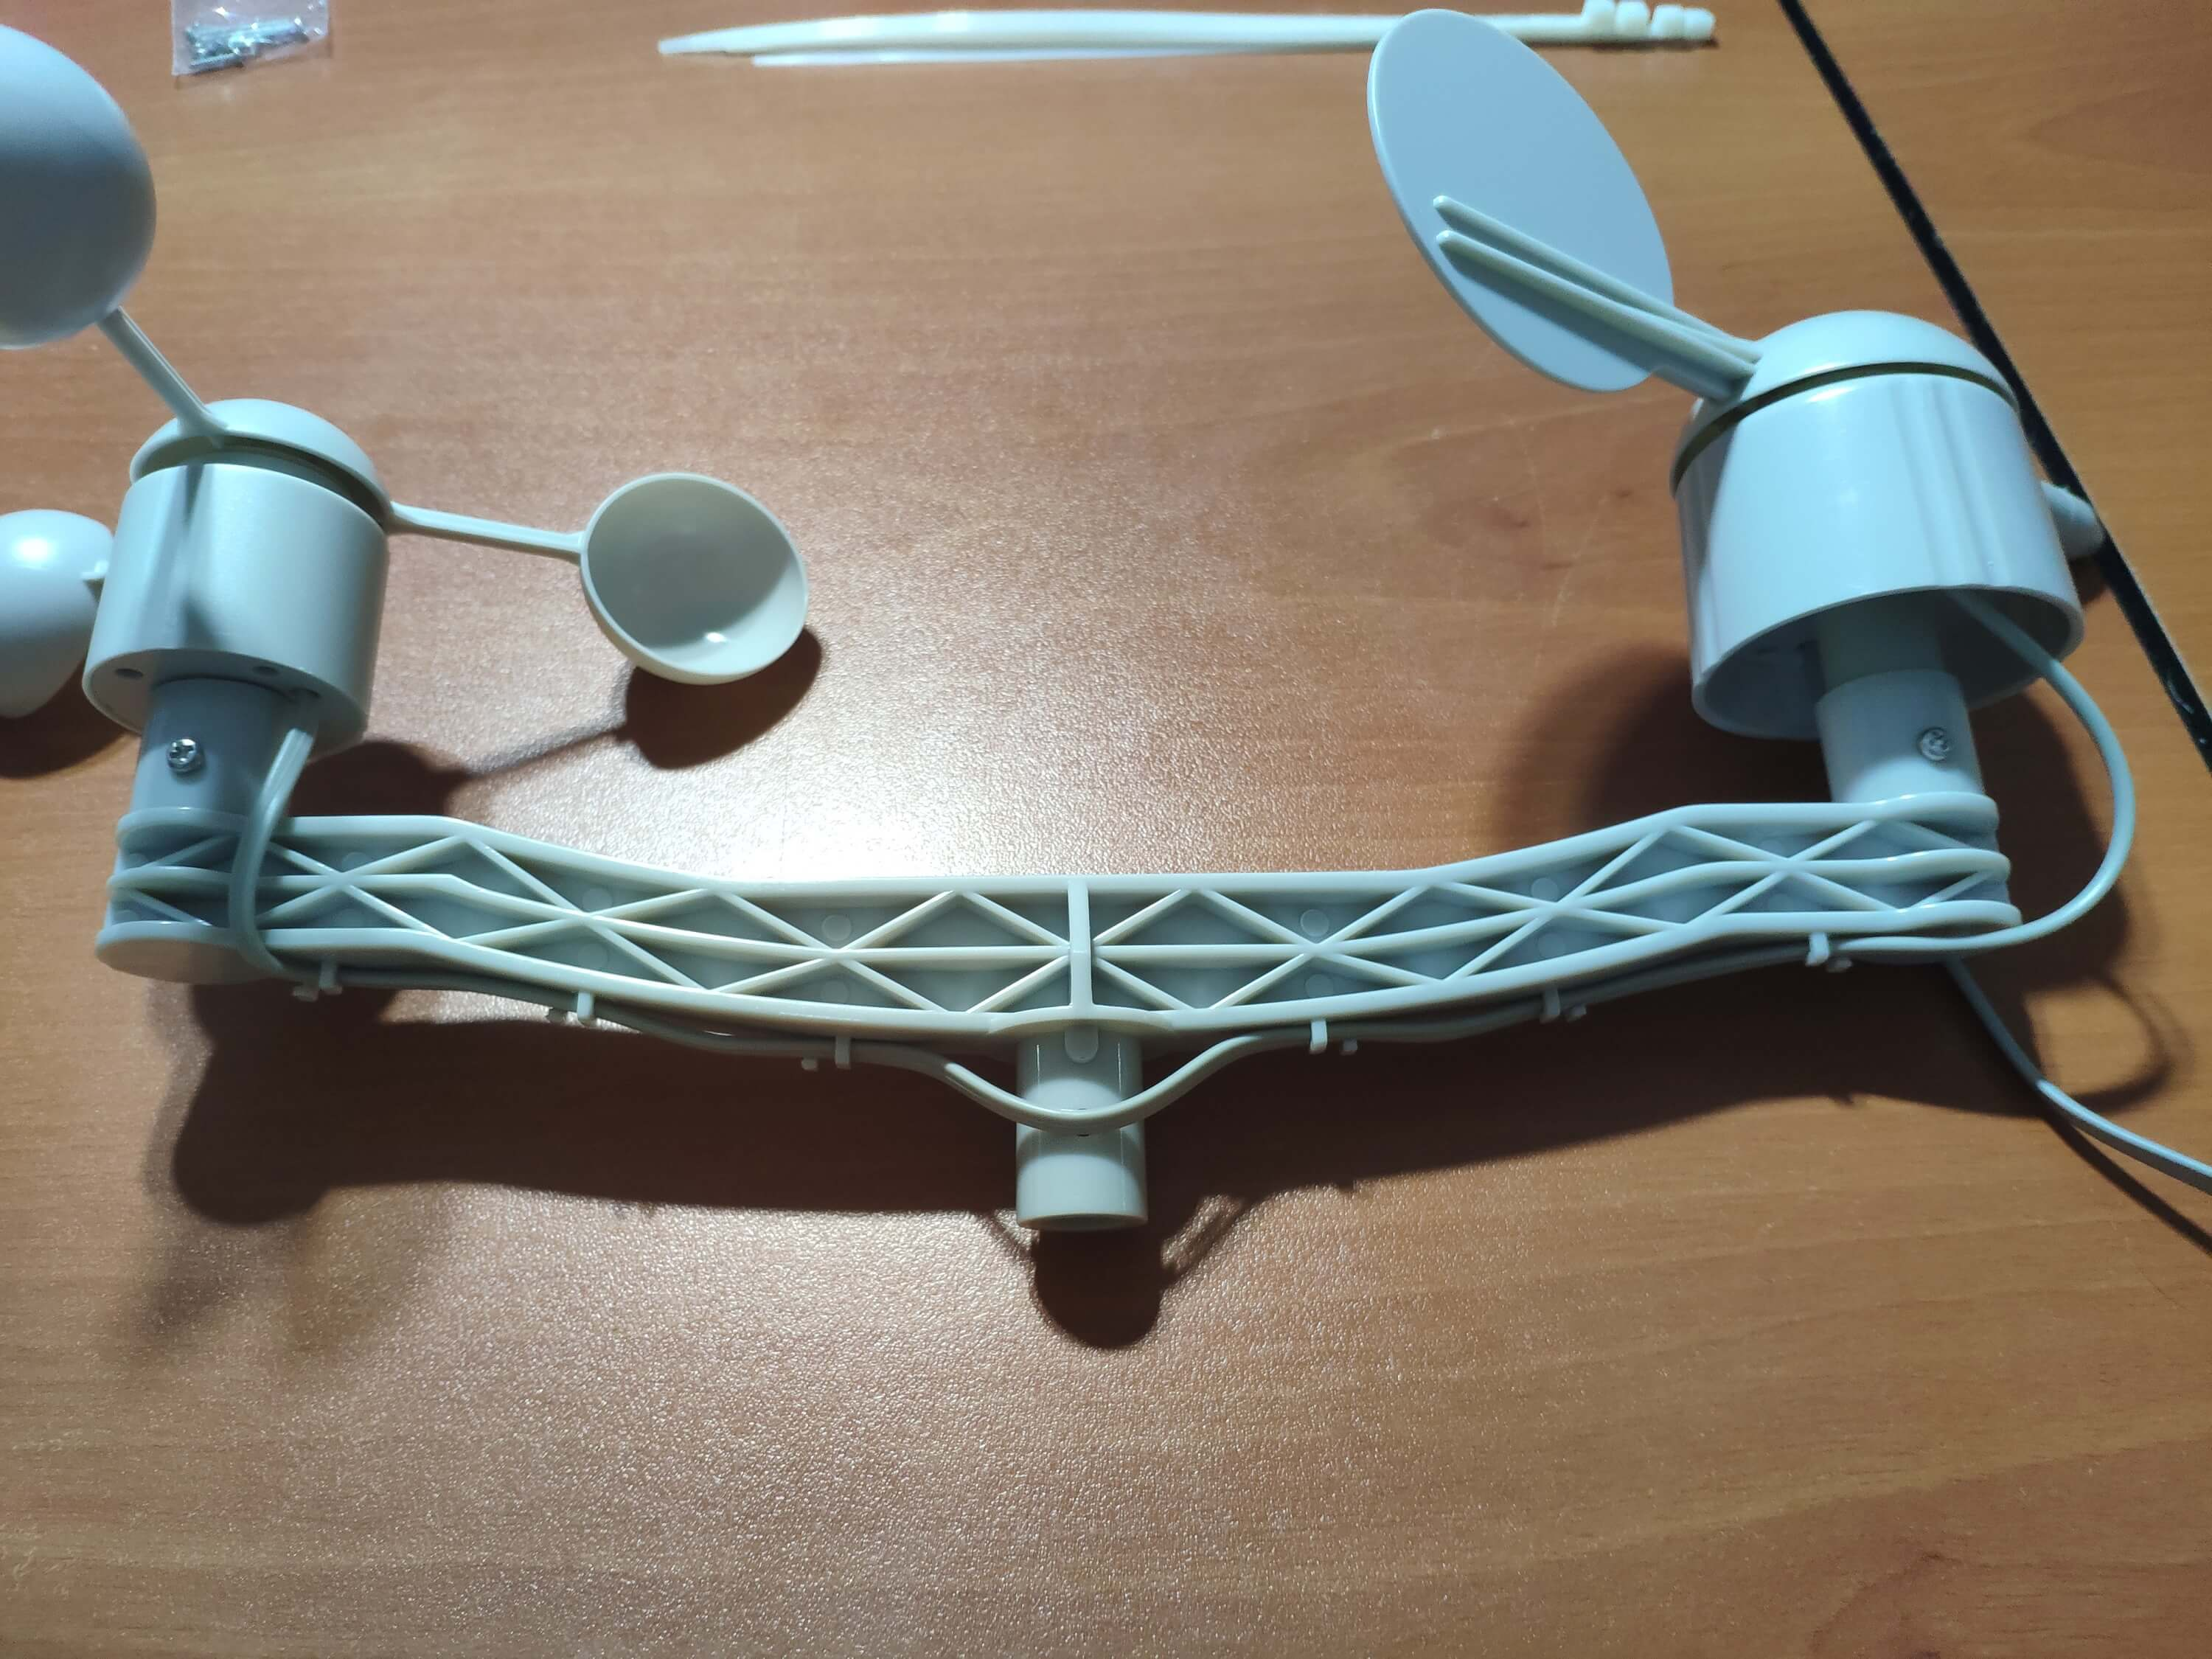
⭐ Bevestig eerst de windmeter en de windvaan met schroeven en moeren aan de brug.
⭐ Sluit de windvaan aan op de windmeter met behulp van het RJ11-telefoonsnoer en draai deze onder de brug vast.
⭐ Monteer vervolgens de roestvrijstalen stok met schroeven aan de brug.
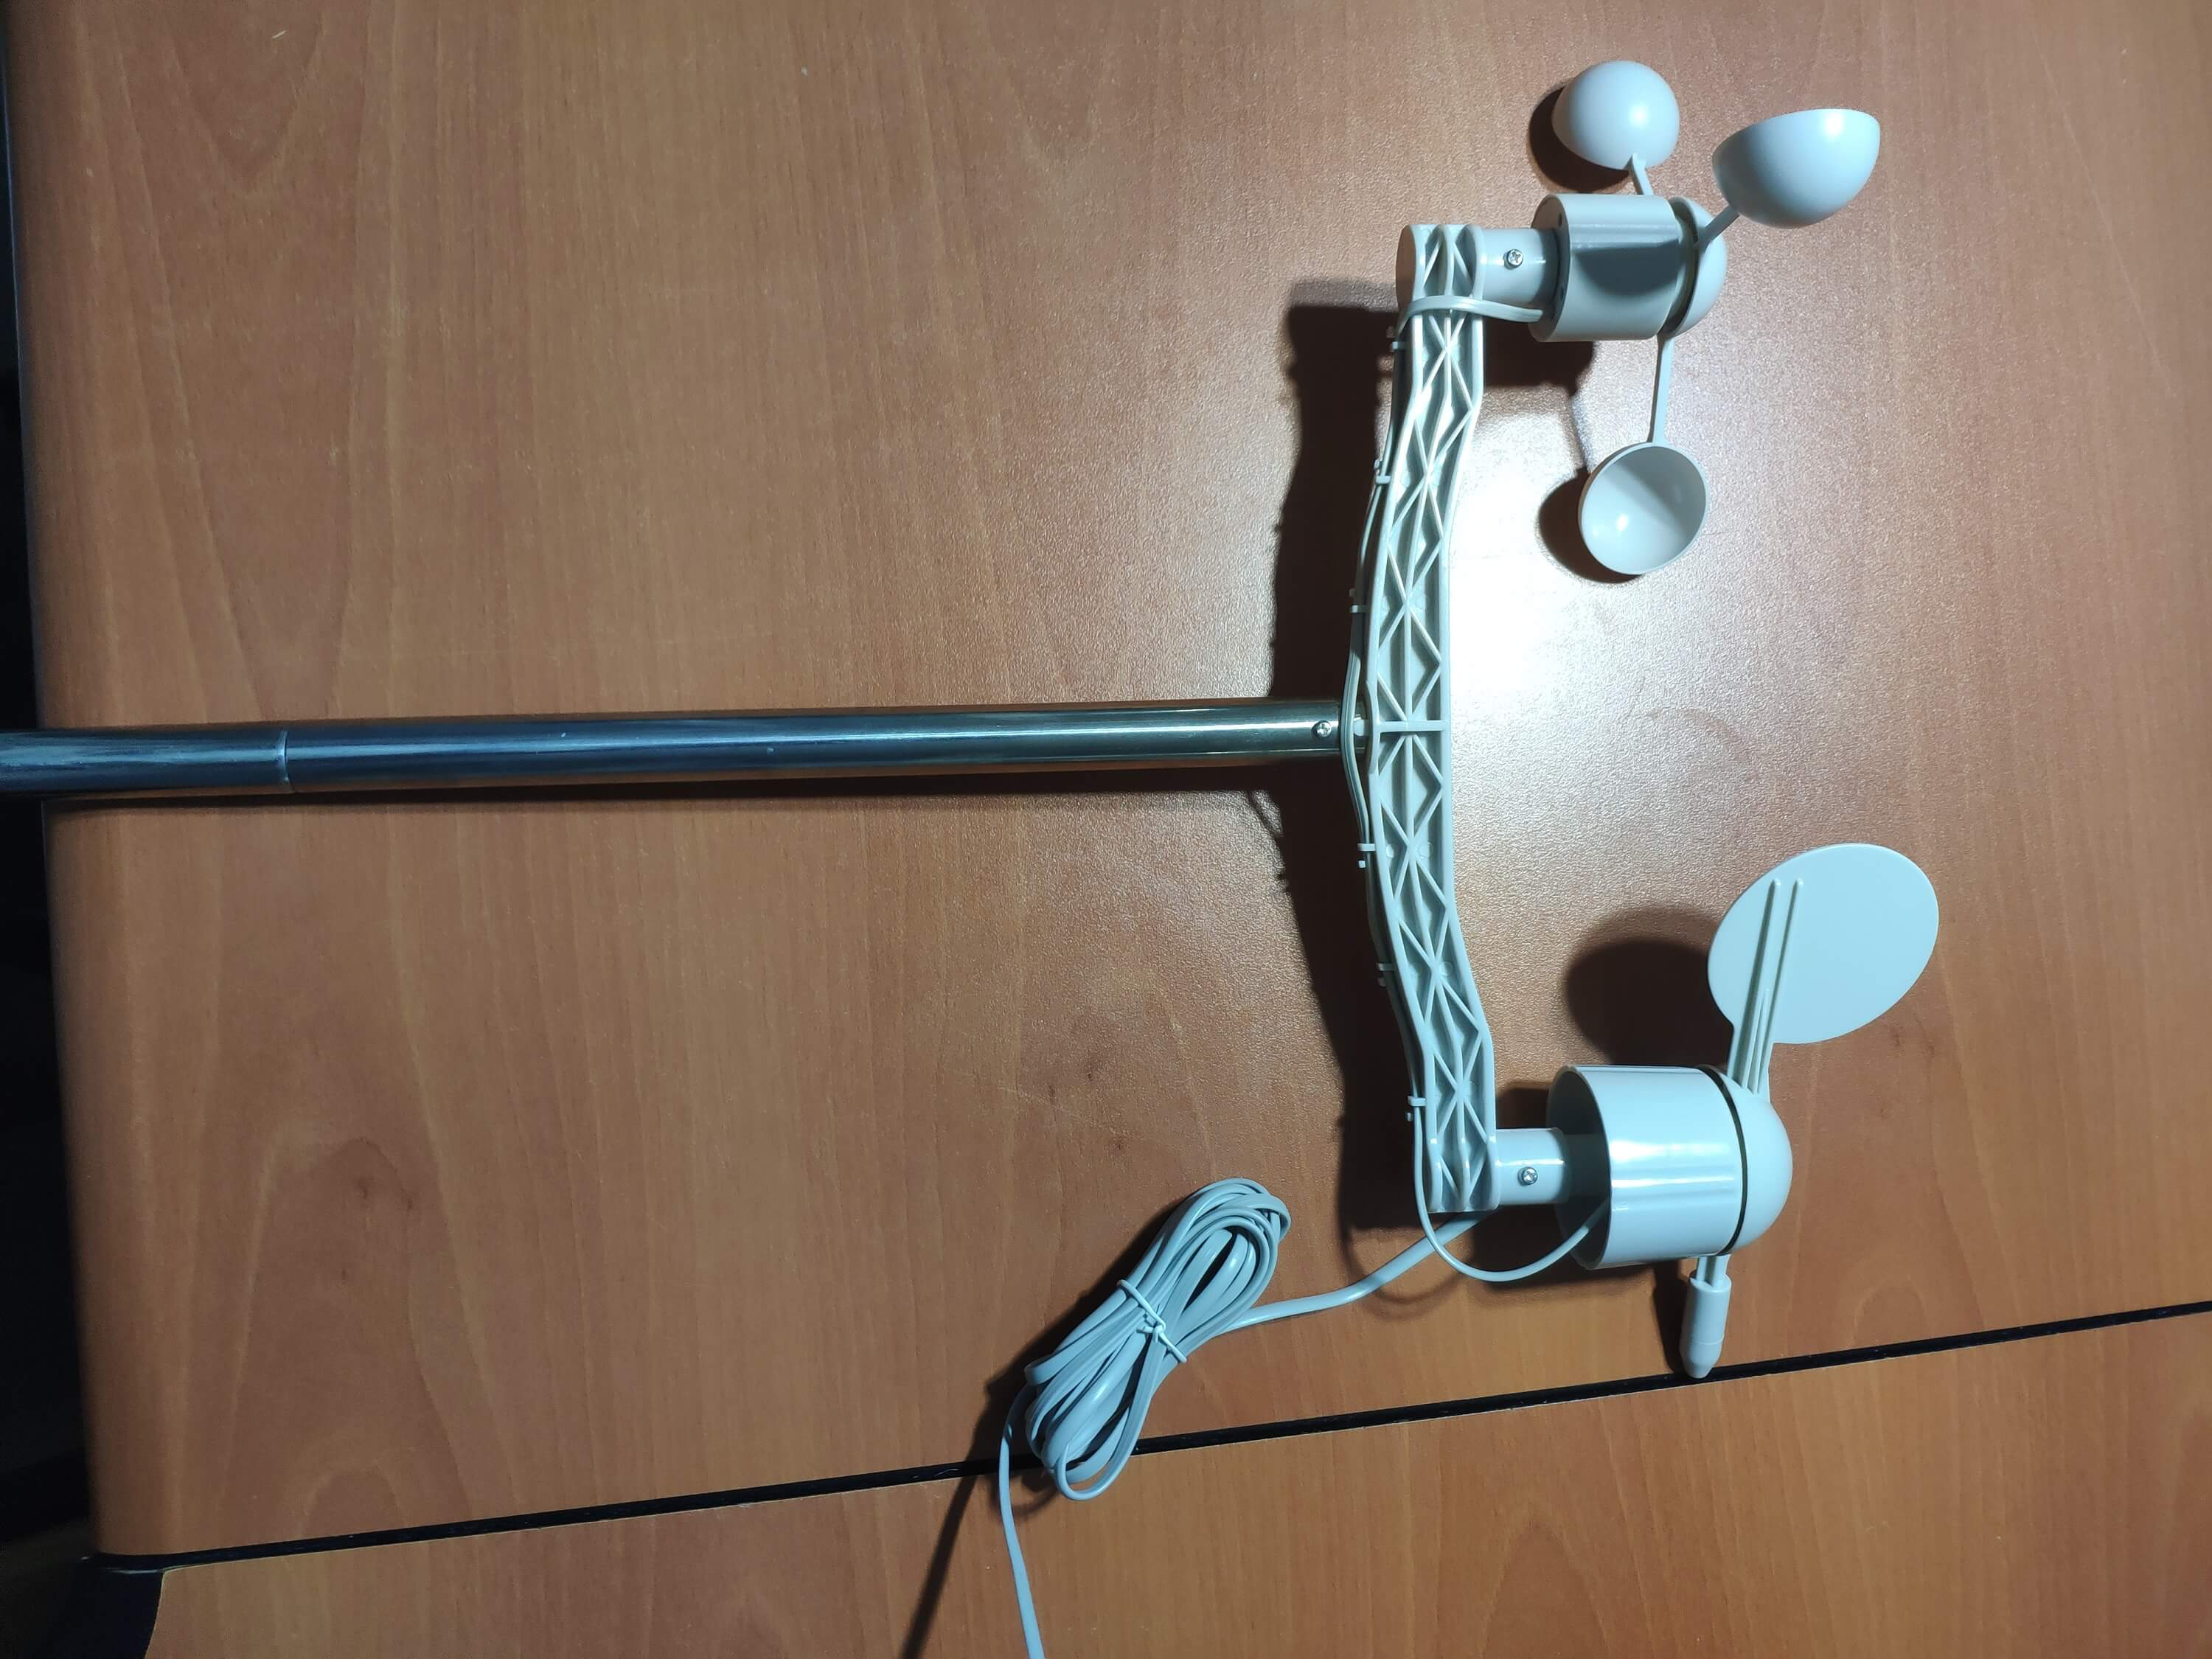
⭐ Installeer de regenemmerverbinding onder de regenemmer met schroeven.
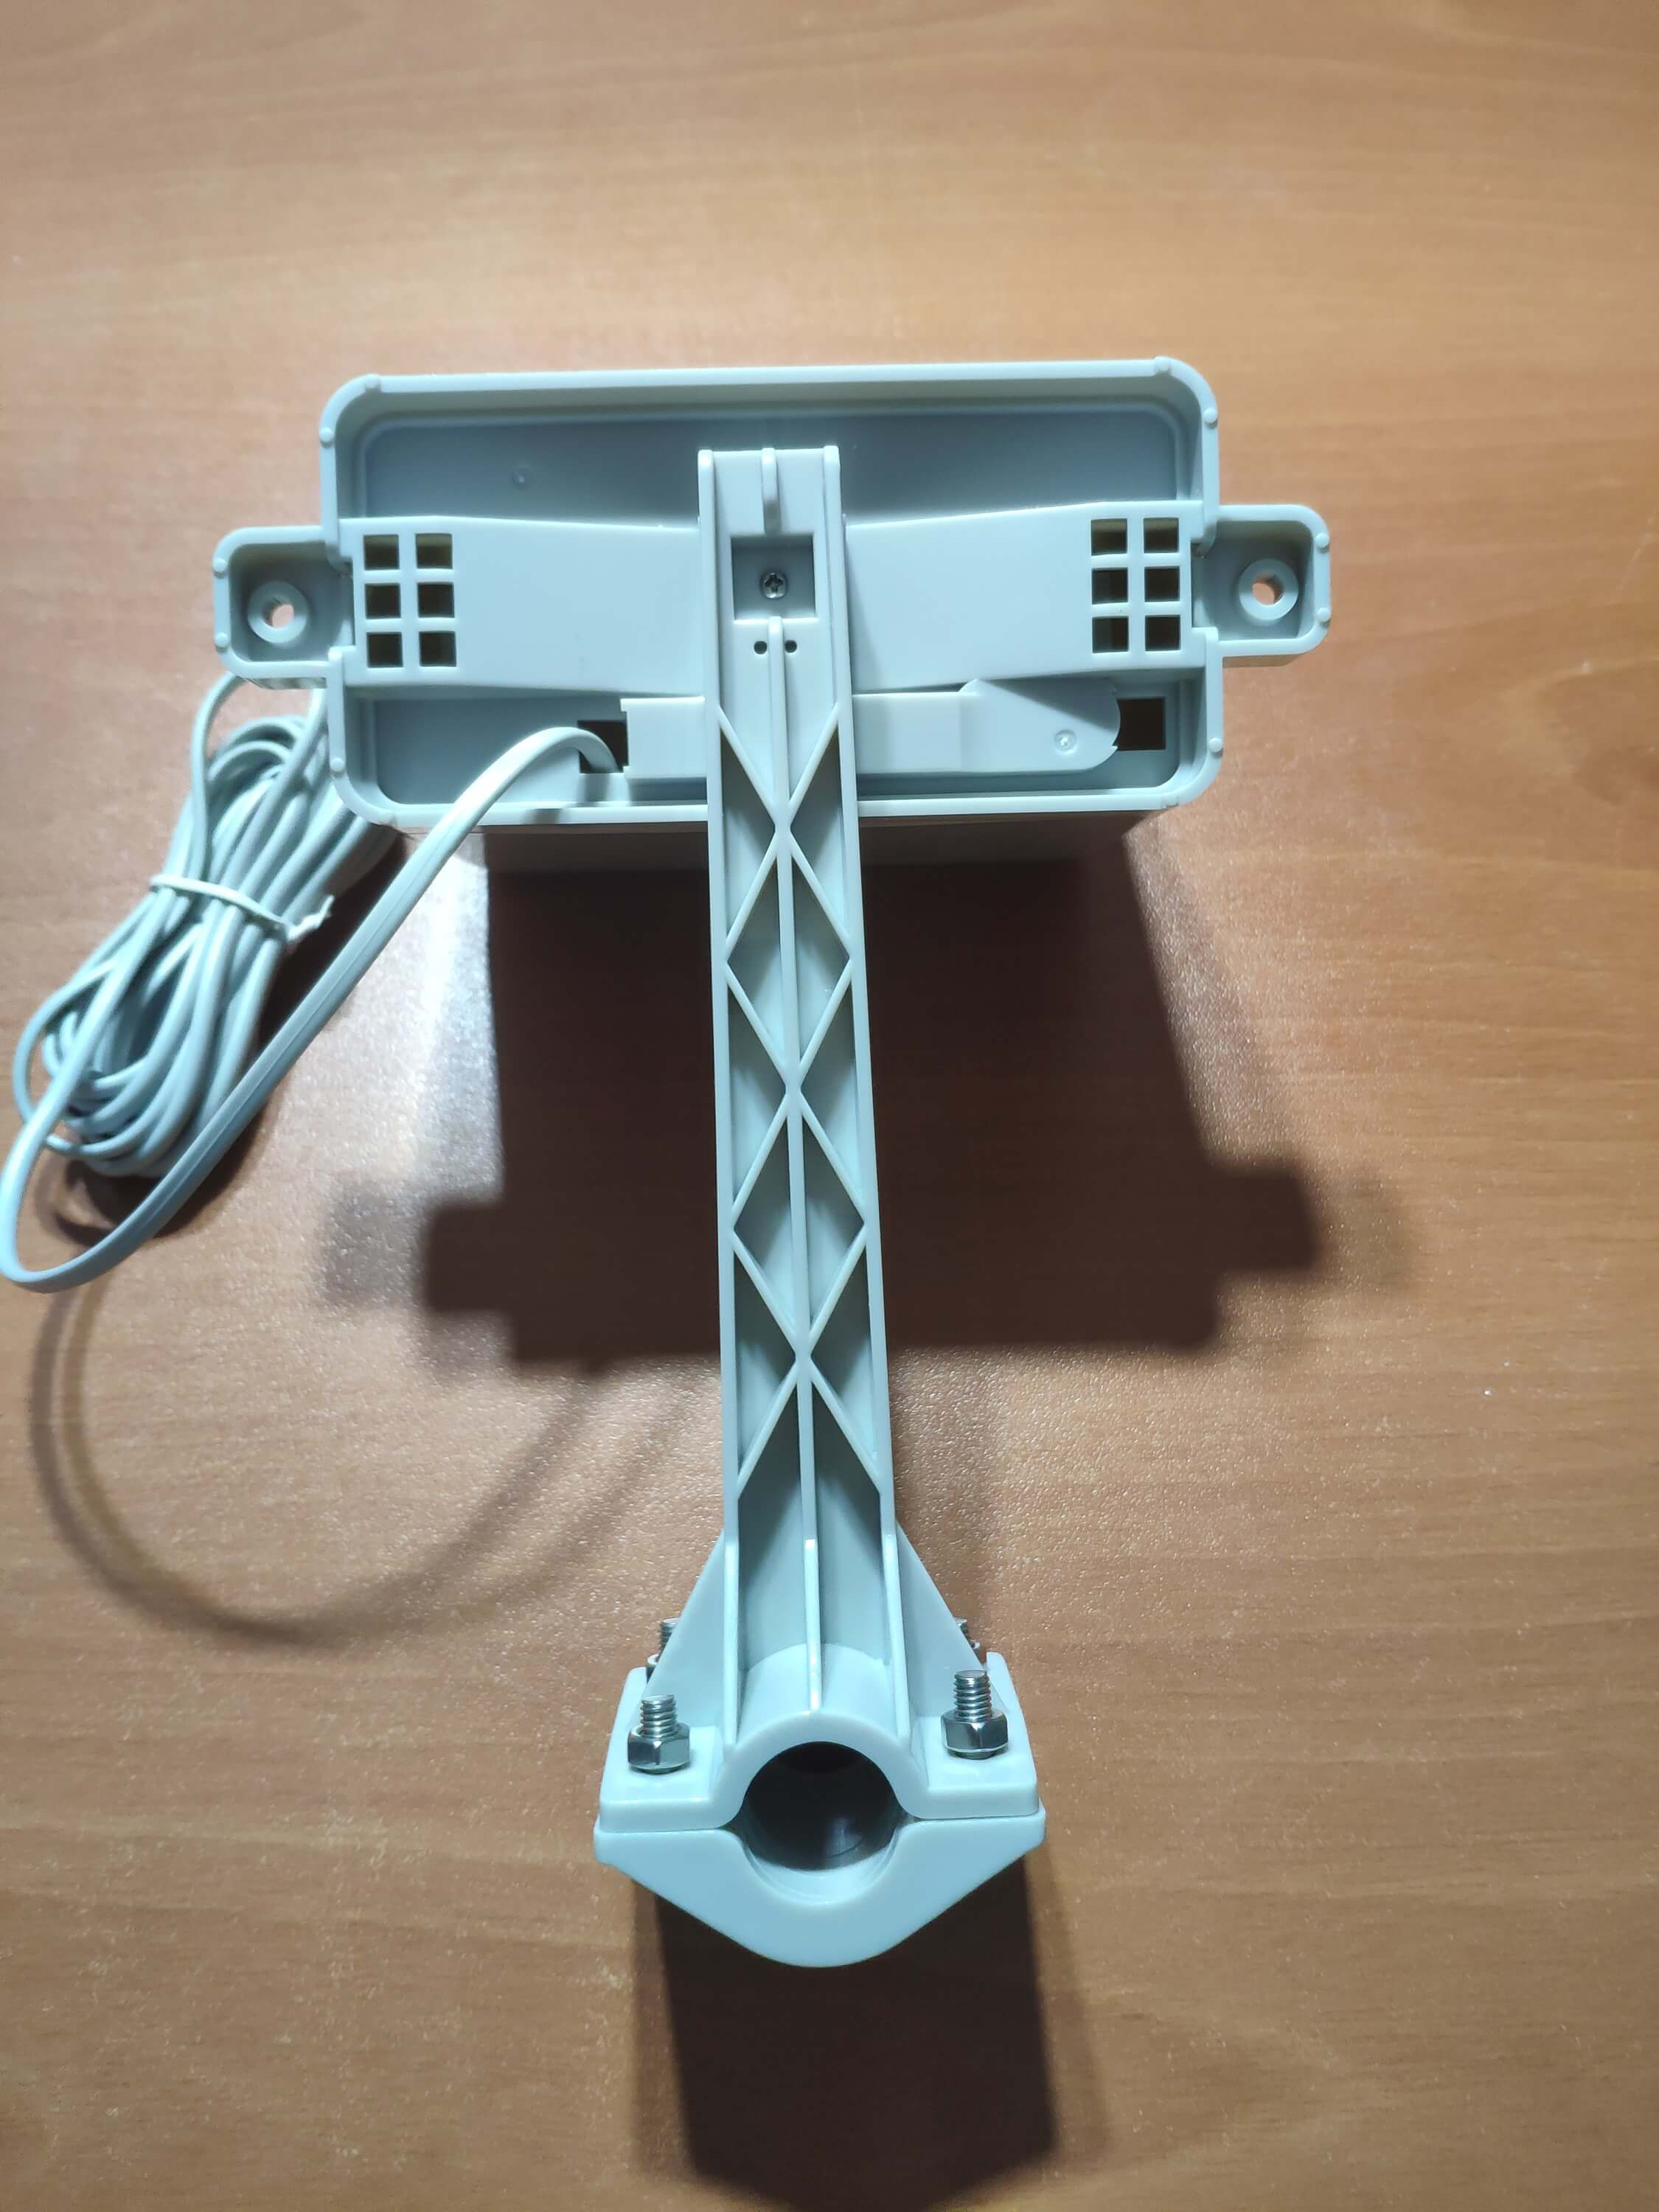
⭐ Plaats tot slot de regenemmer op de roestvrijstalen stok met behulp van schroeven en moeren.
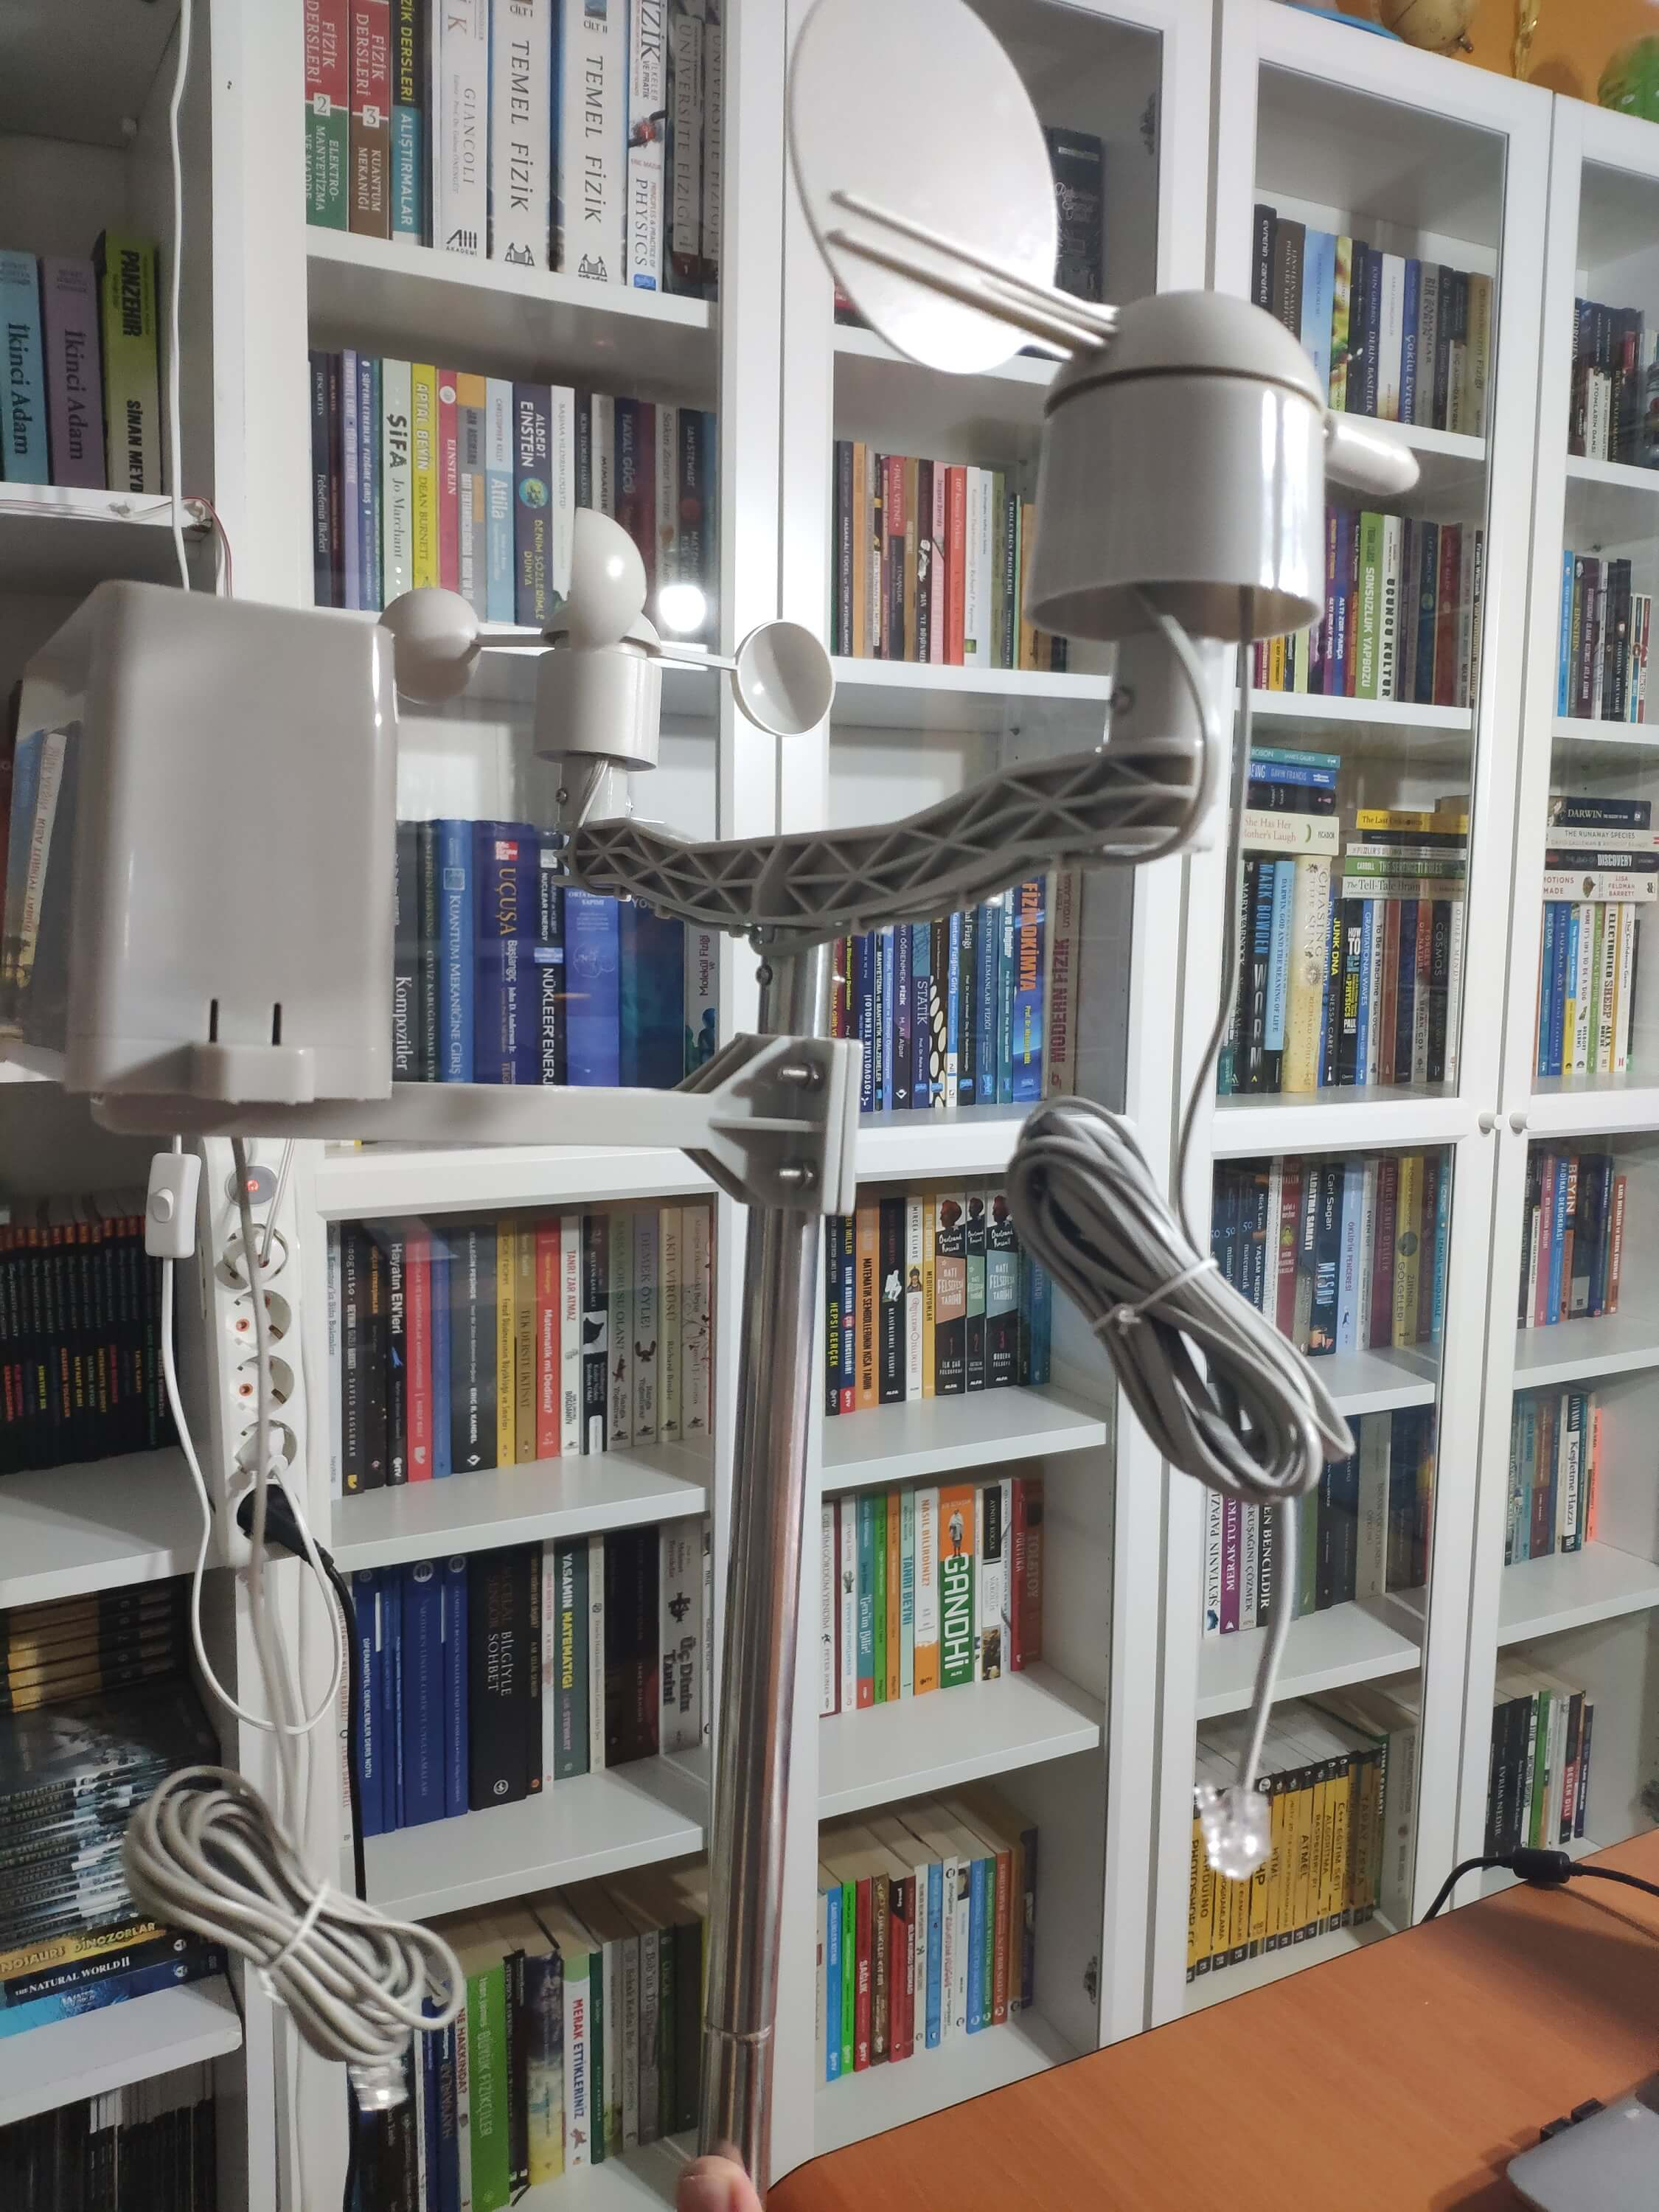
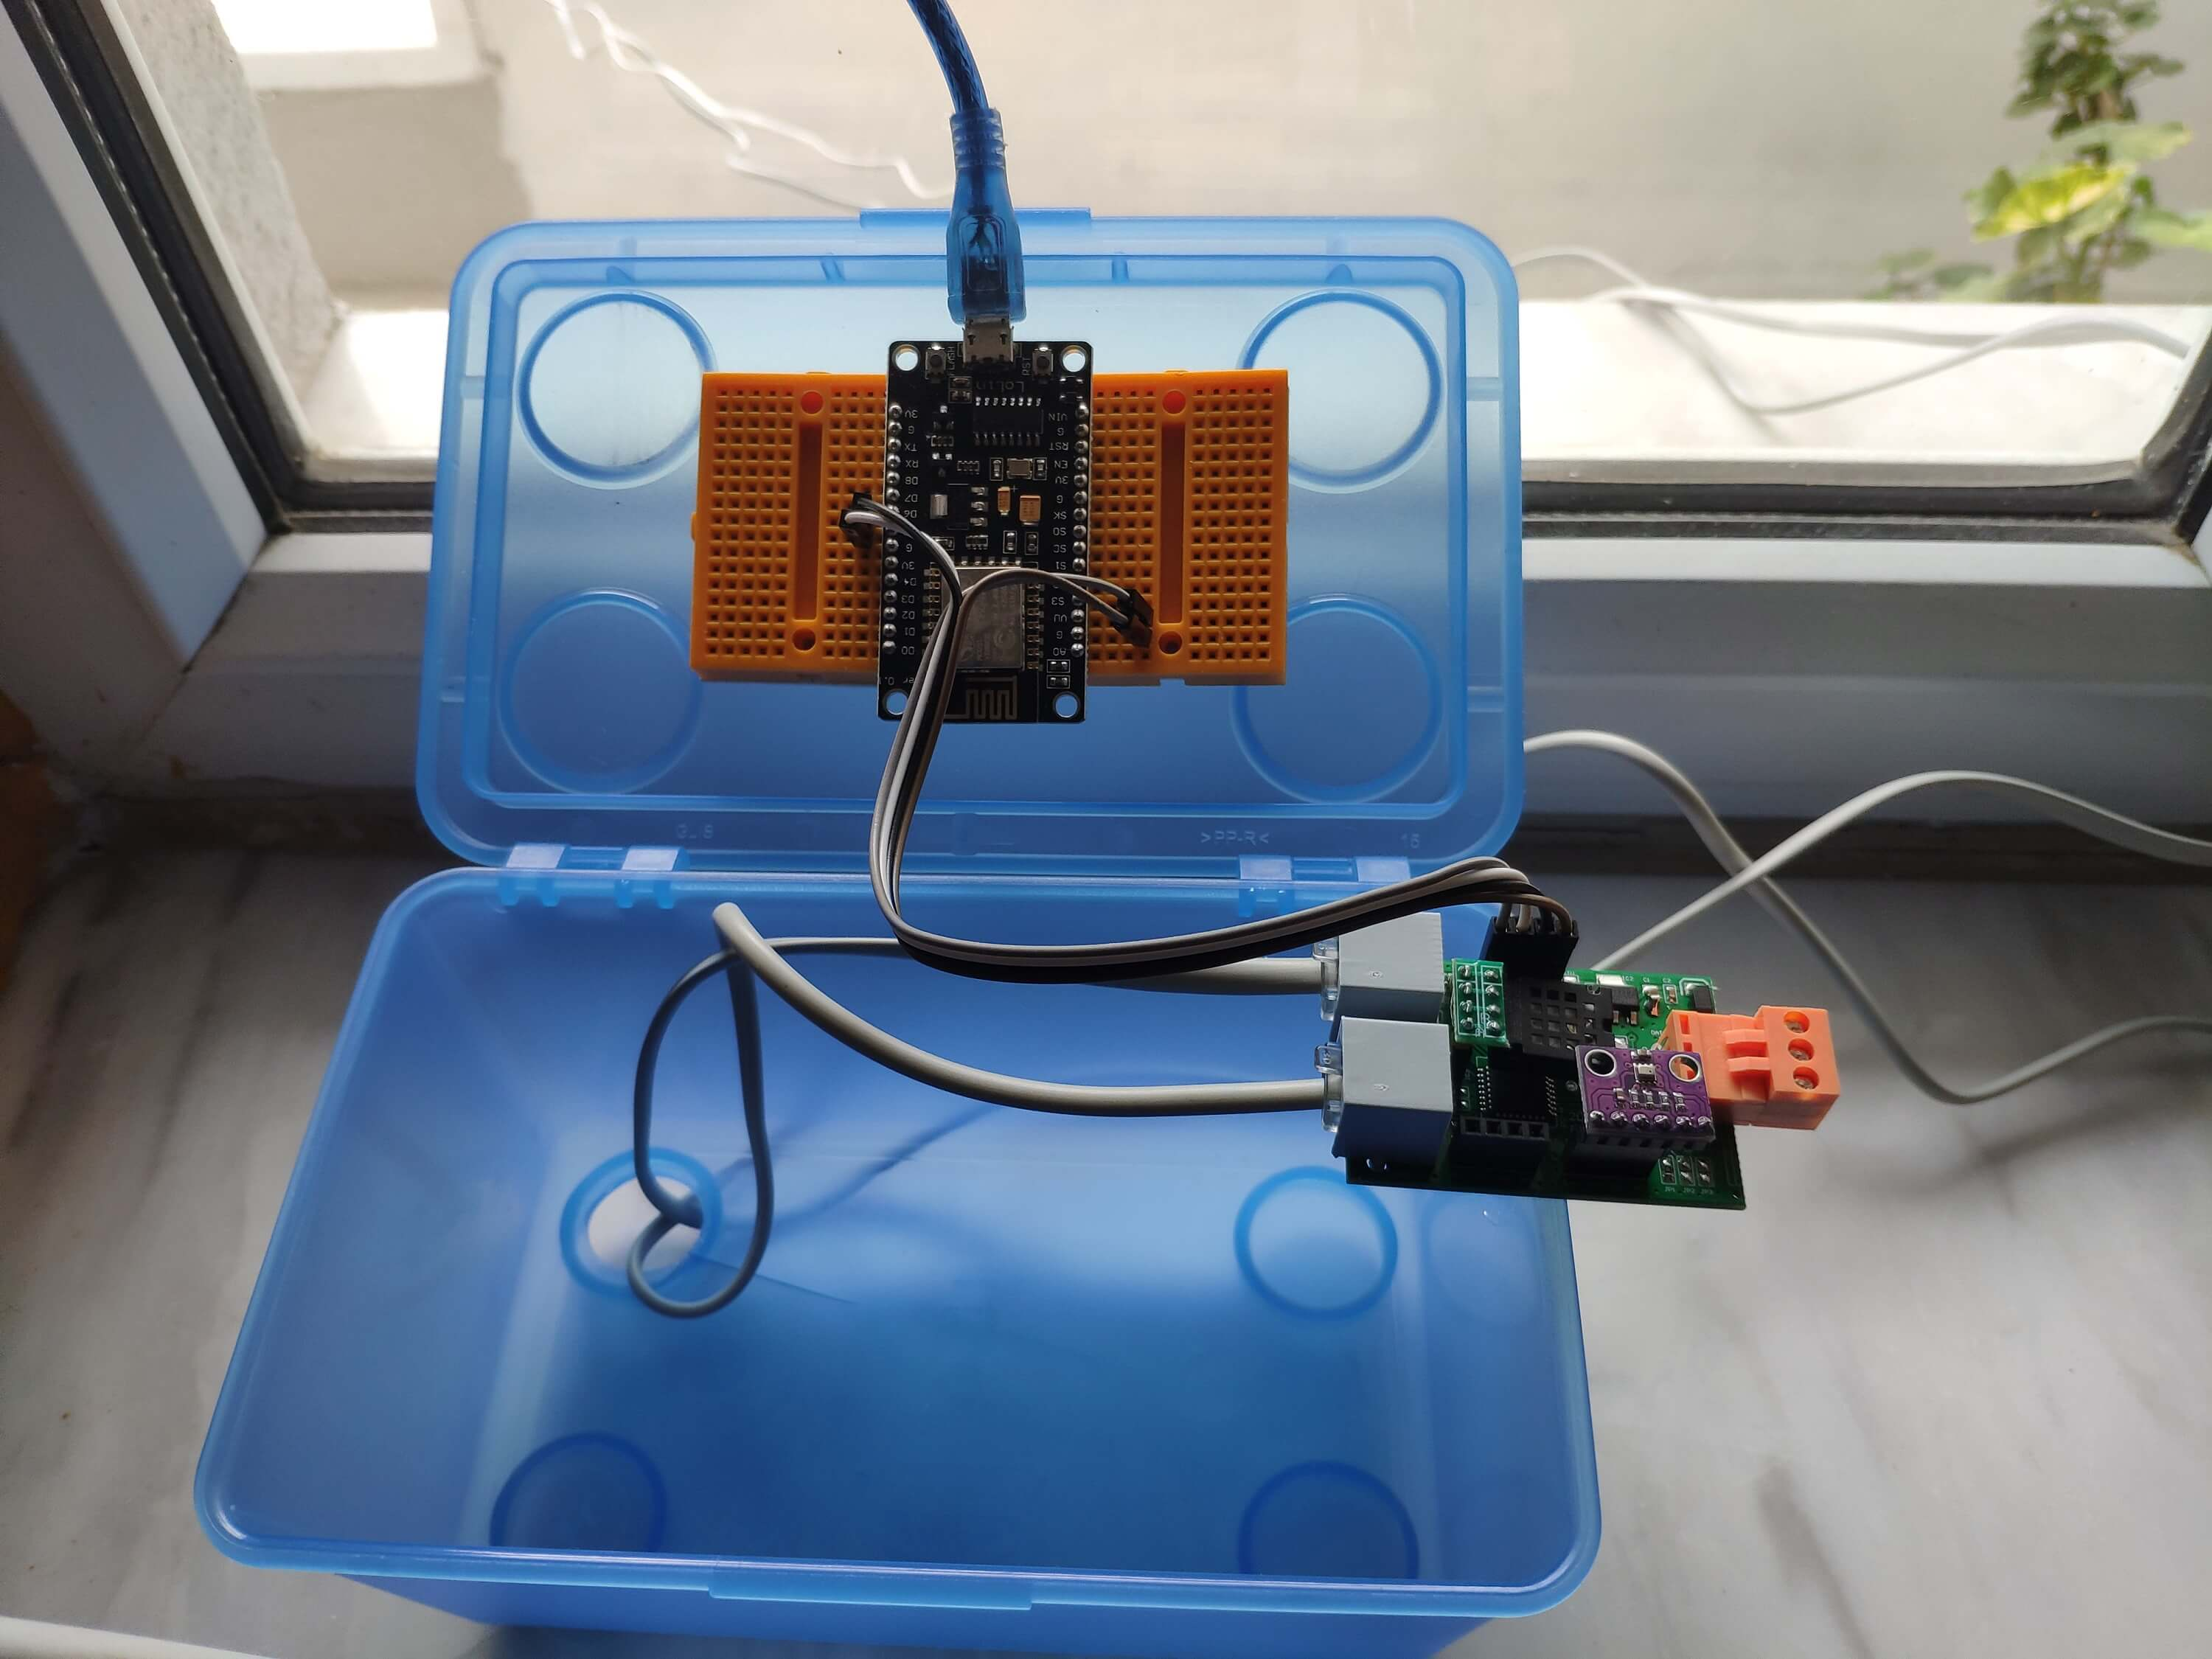
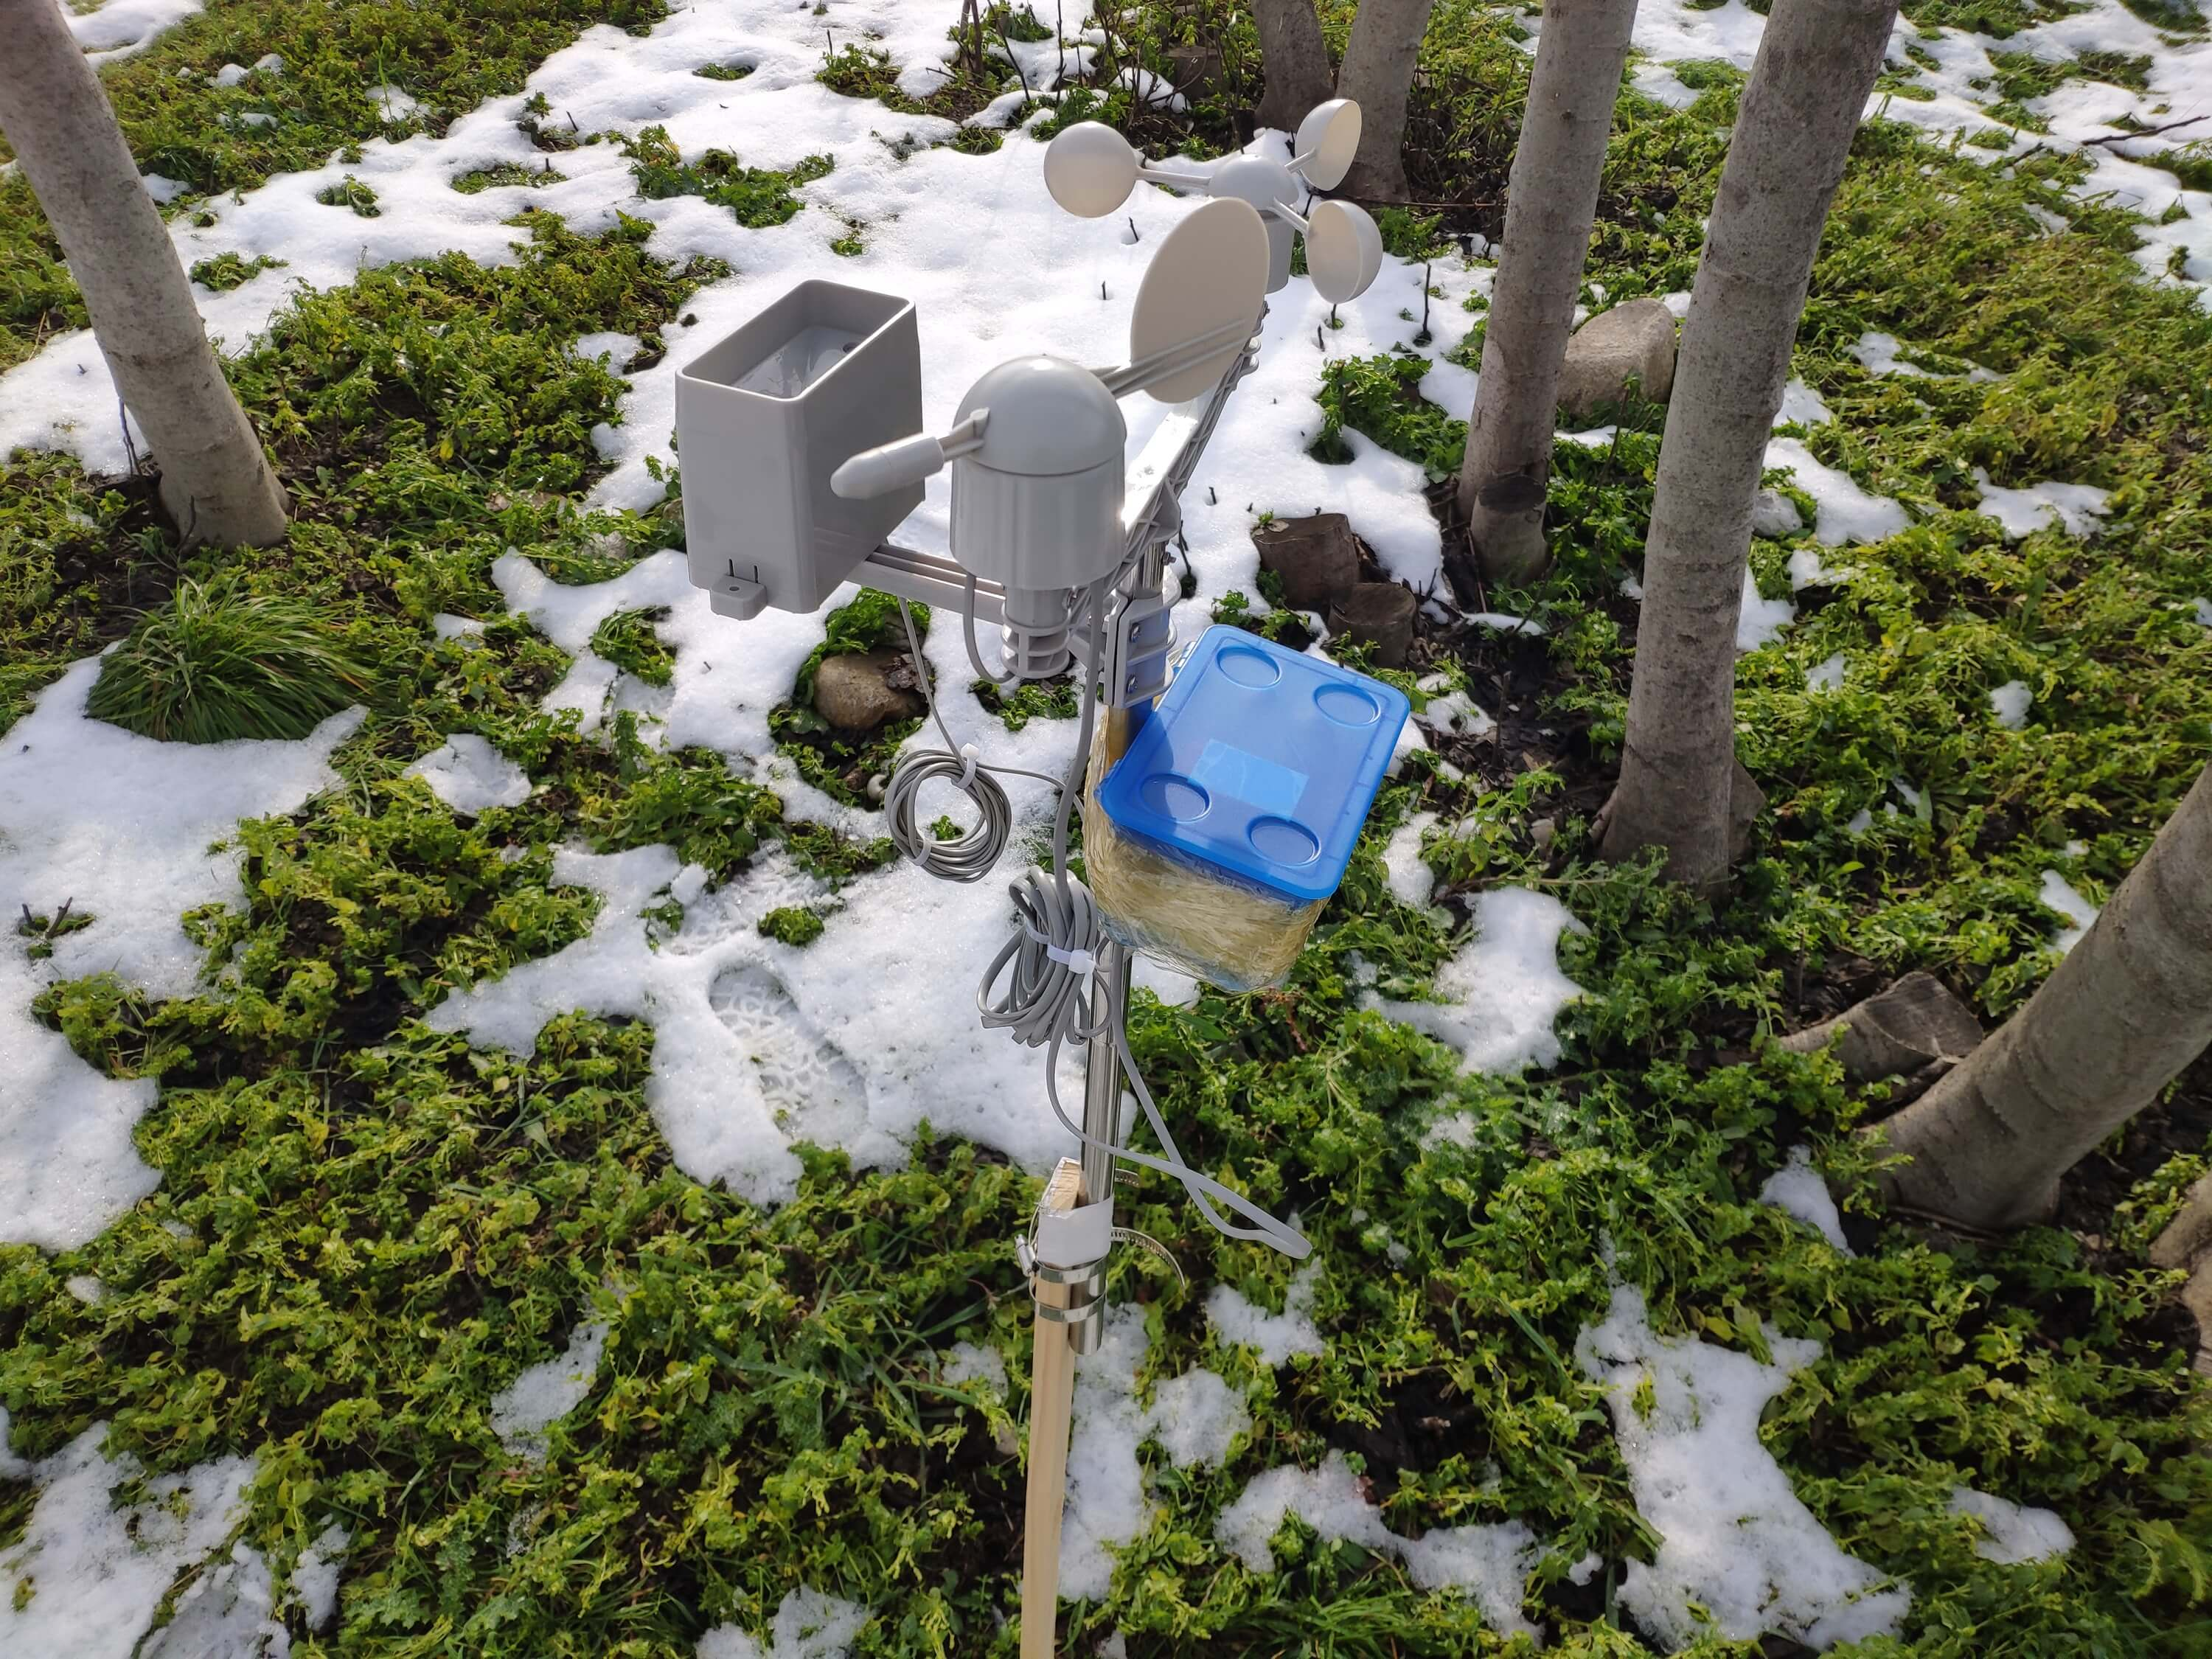
⭐ Nu is het klaar om weergegevens te verzamelen, zelfs in extreme weersomstandigheden. Het sensorbord (converter) is echter niet weerbestendig, dus heb ik een plastic doos aan het weerstation toegevoegd om het sensorbord en het SIM808-schild buitenshuis te beschermen.
Stap 2:Weergegevens verzamelen op Google Spreadsheets
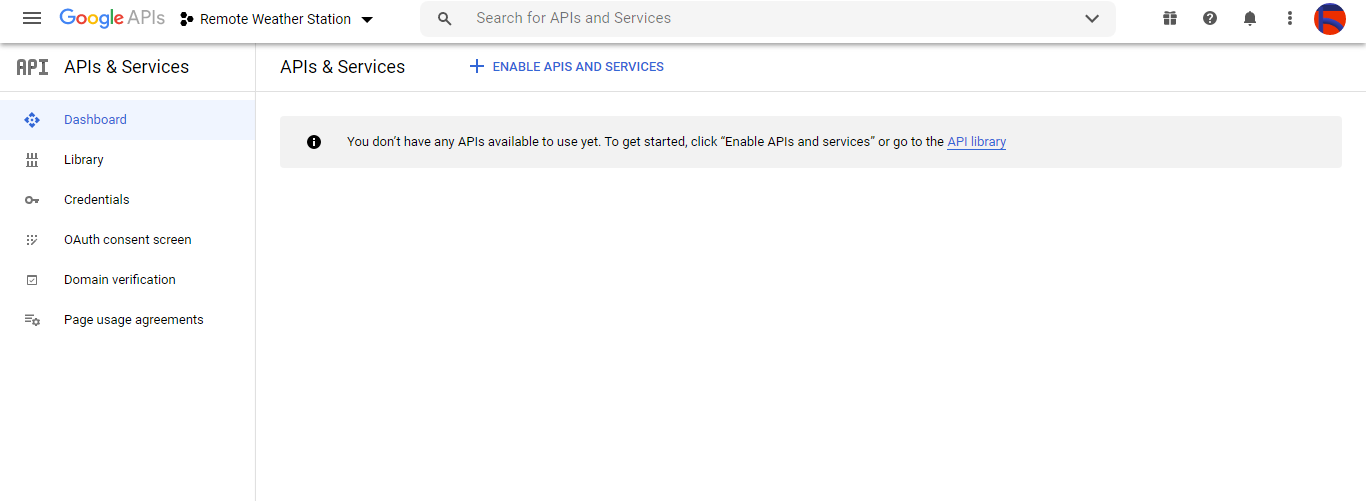
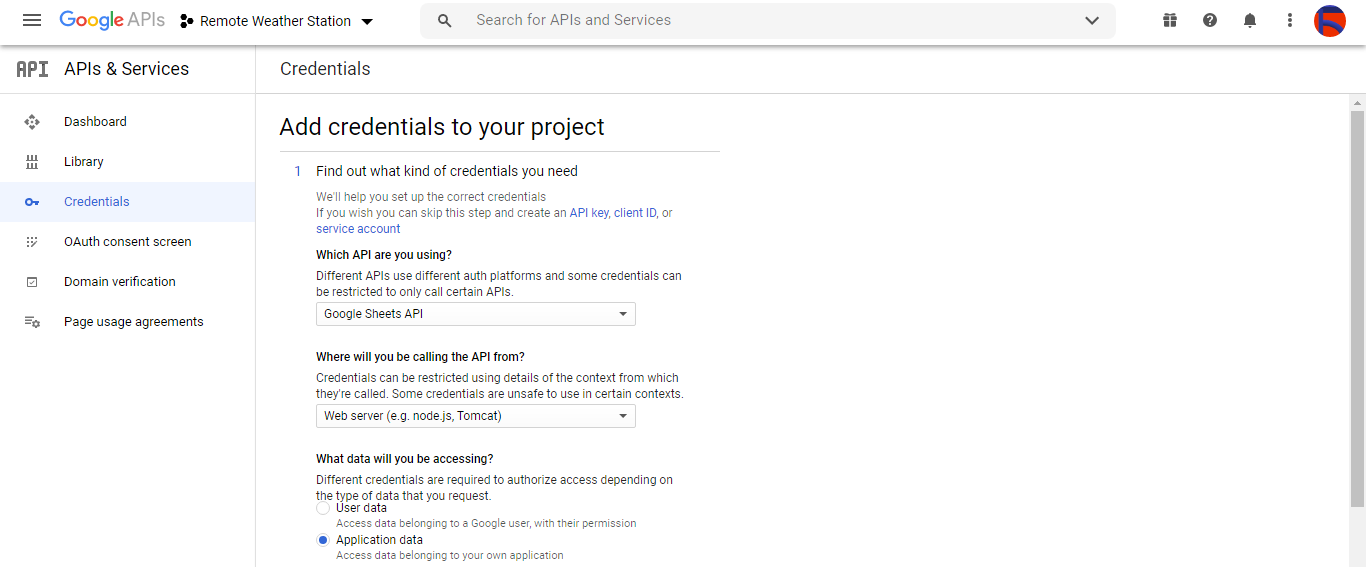
Als u informatie naar een spreadsheet op Google Spreadsheets wilt verzenden, moet u een nieuwe toepassing maken in de Google Developer Console en verificatiegegevens ophalen om de Google Spreadsheets-API te gebruiken. Als u een beginner bent in het maken van applicaties met de Google Developer Console, volgt u de onderstaande instructies.
⭐ Ga naar de Google Developer Console en klik op de knop 'NIEUW PROJECT'. Voer de projectnaam in als Extern weerstation .

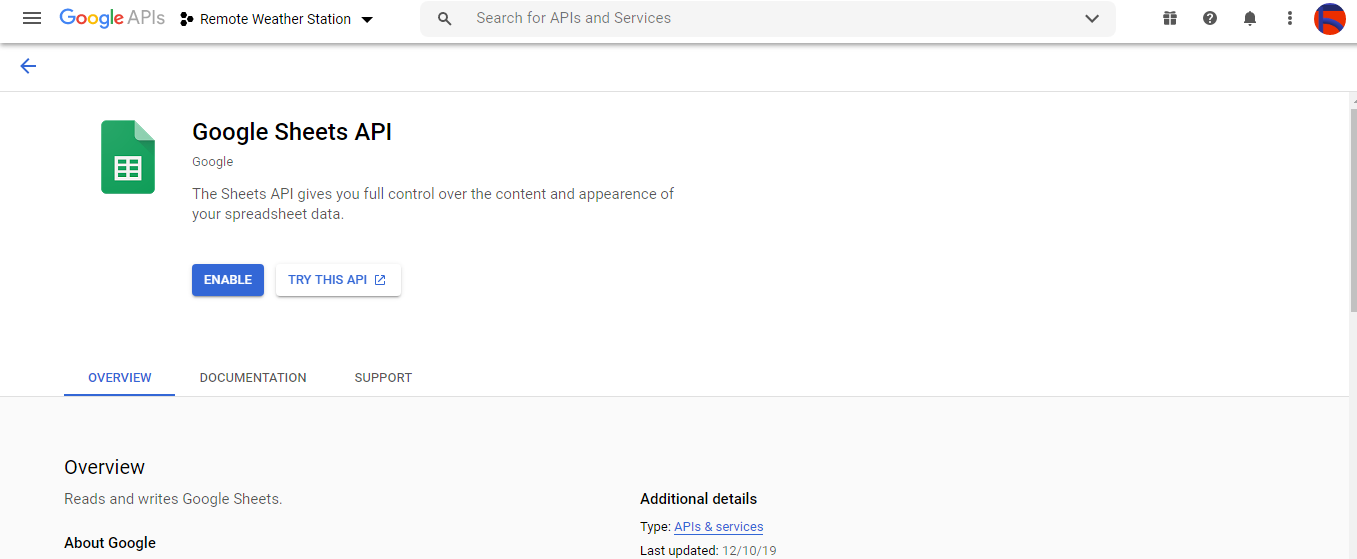
⭐ Ga naar de API's en services en klik op de API-bibliotheek om de Google Spreadsheets API in te schakelen.
Stap 2.1:Inloggegevens verkrijgen om de Google Spreadsheets API te gebruiken
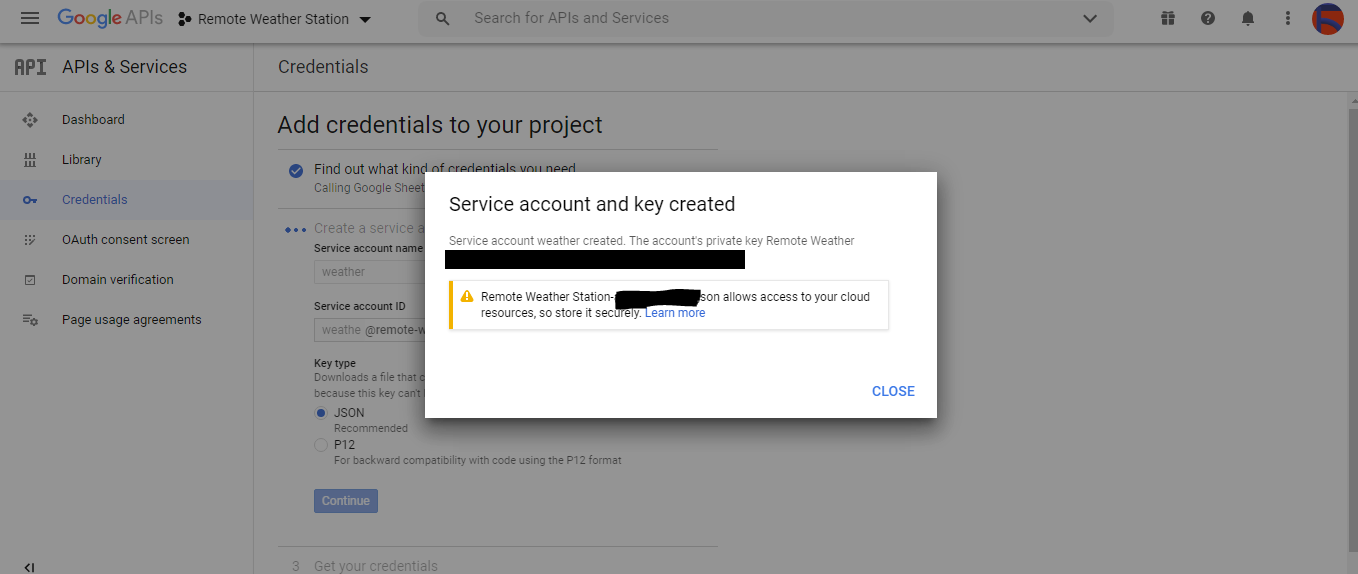
⭐ Open het projectdashboard en klik op de Inloggegevens knop. Vul dan het onderstaande formulier in om het serviceaccount en de sleutel aan te maken.
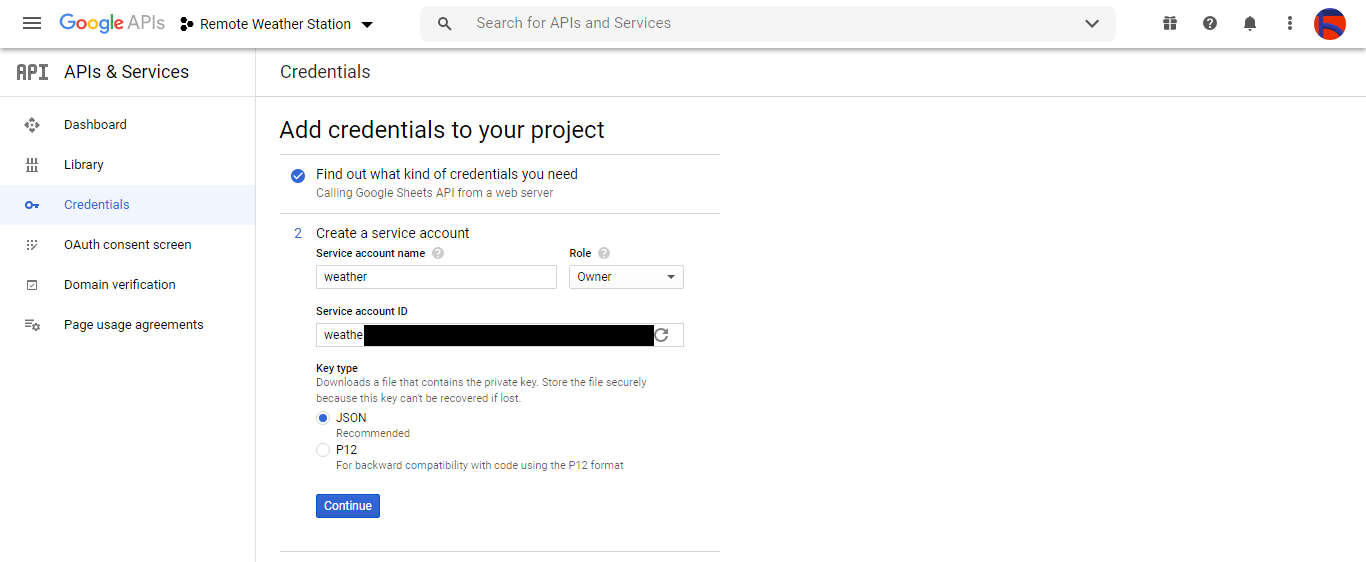
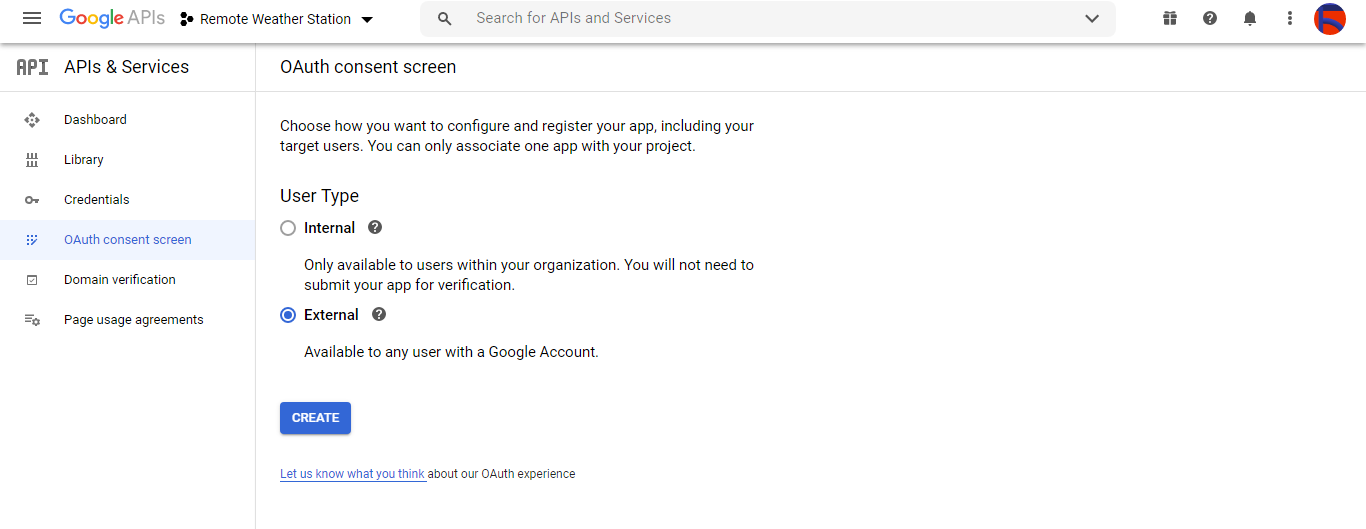
⭐ Klik op de CRELE INLICHTINGEN MAKEN knop en configureer het toestemmingsscherm om een OAuth-client-ID te kunnen maken.
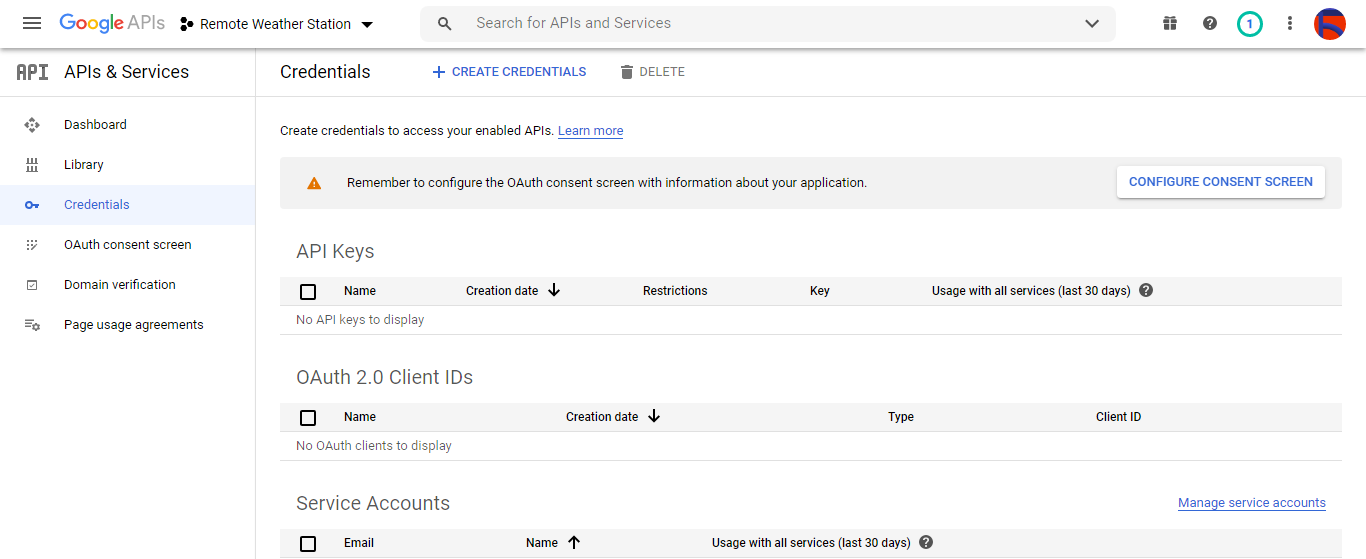
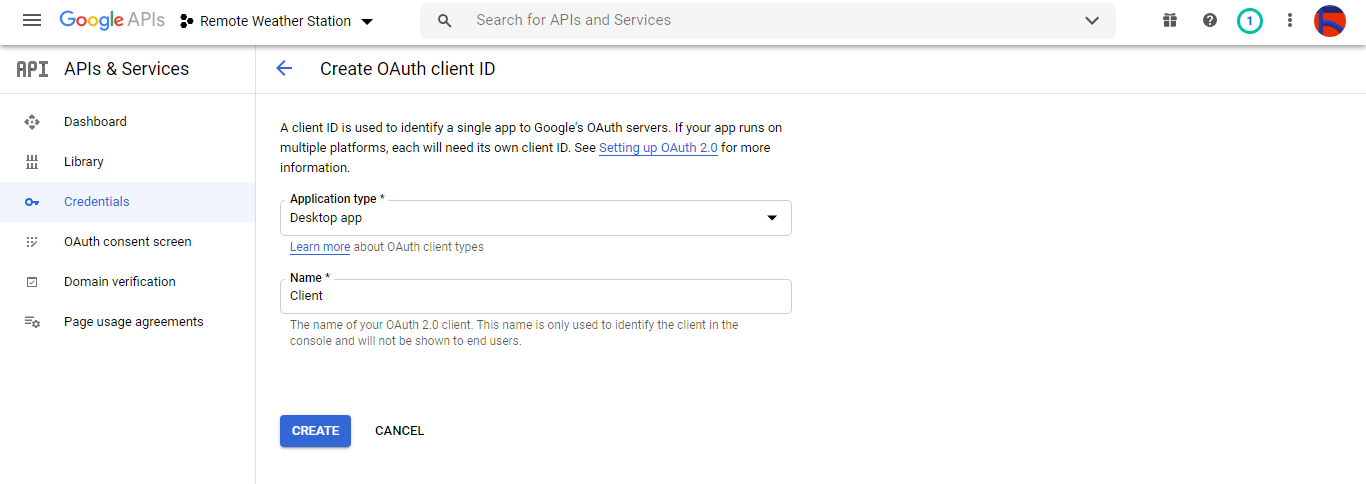
⭐ Maak vervolgens een nieuwe OAuth-client-ID met de naam Client onder Desktop-app (toepassingstype).
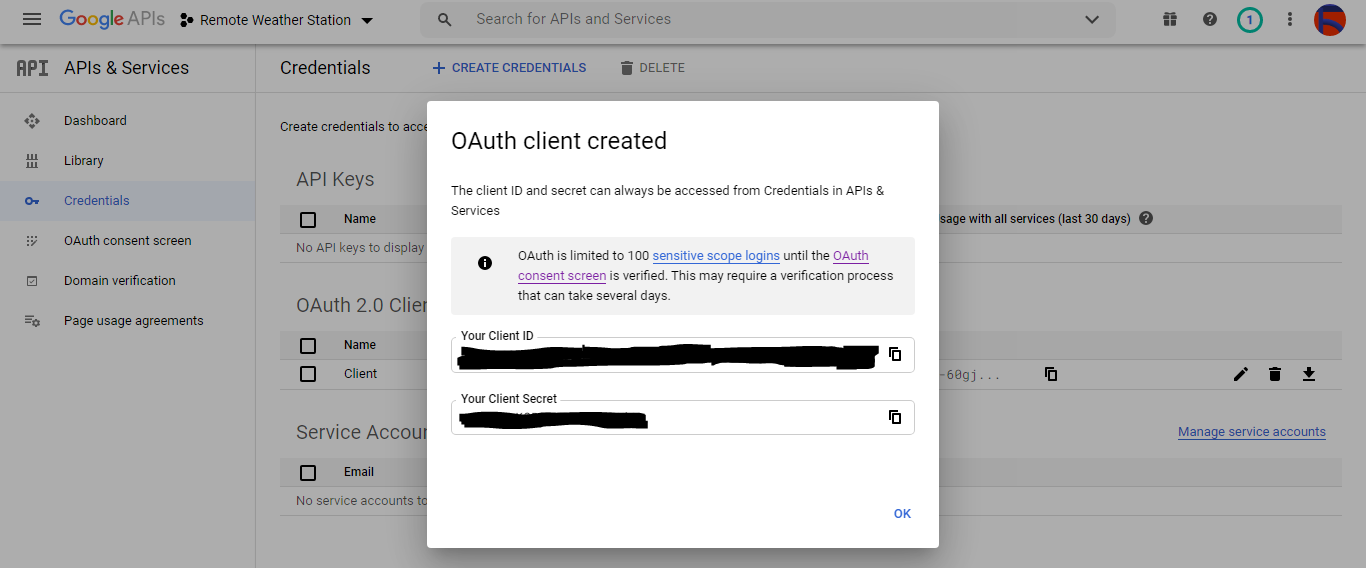
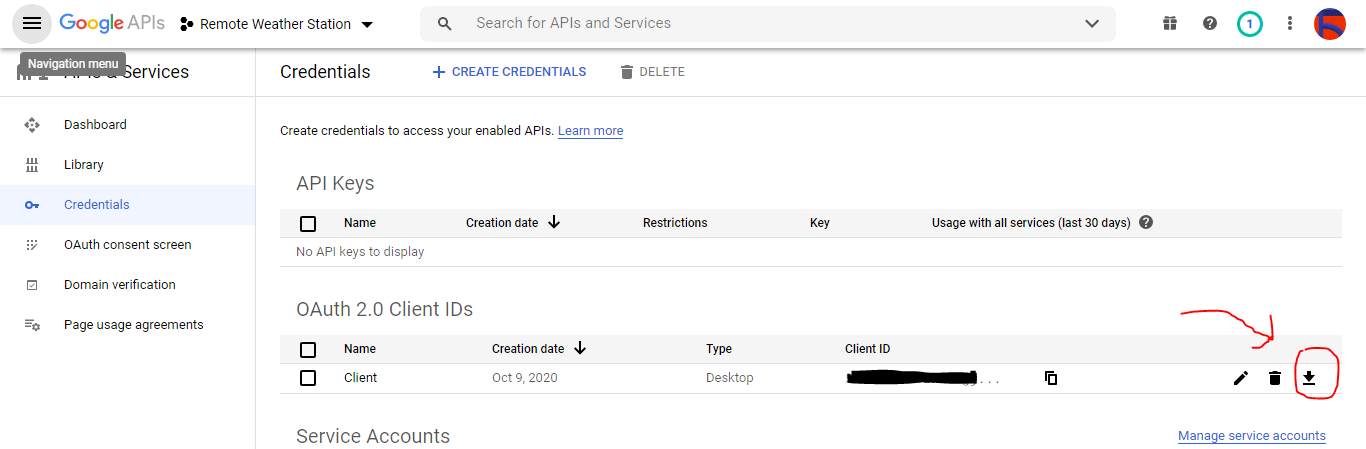
⭐ Na het aanmaken van de OAuth-client-ID (Client) download de inloggegevens (ID en geheim) en noem het bestand credentials.json .
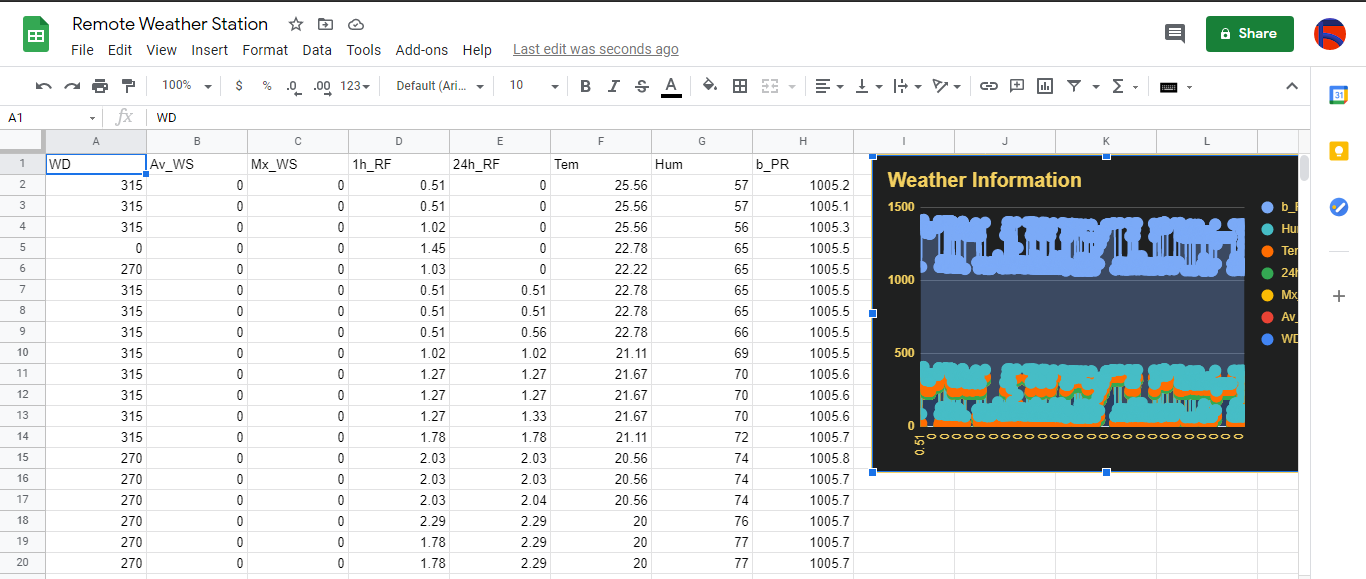
Stap 2.2:Een spreadsheet maken op Google Spreadsheets
⭐ Ga naar Google Spreadsheets en selecteer Persoonlijk .

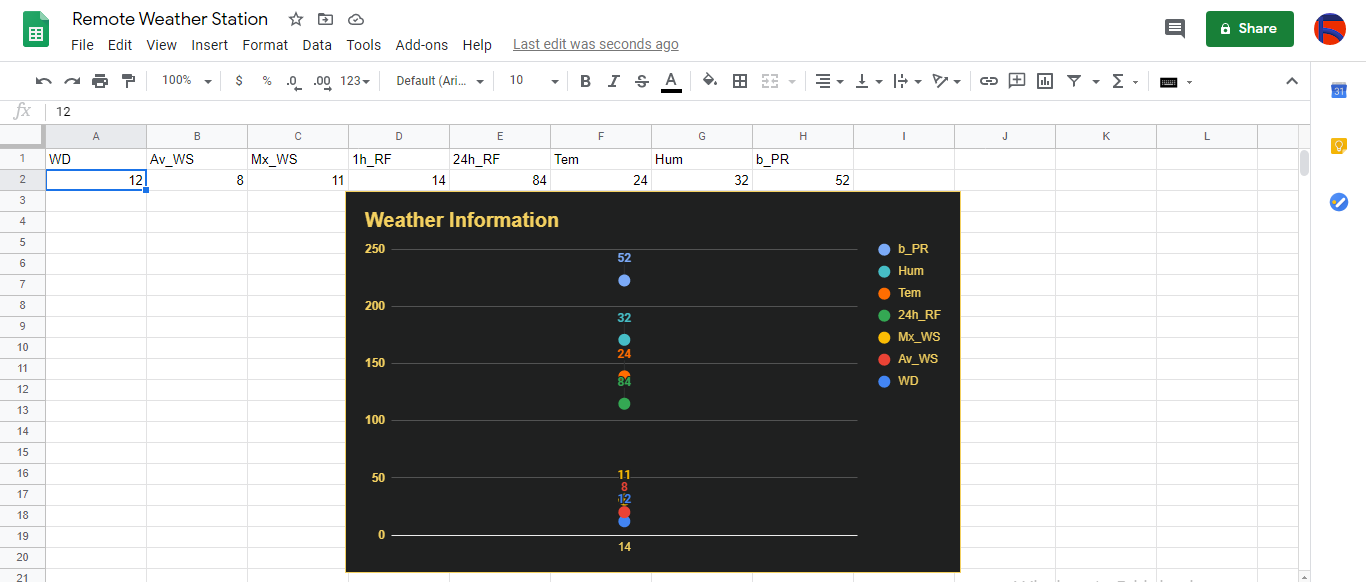
⭐ Maak een Leeg spreadsheet en noem het Extern weerstation .
⭐ Definieer vervolgens de kolomnamen als de eerste rij:
- WD
- Av_WS
- Mx_WS
- 1u_RF
- 24h_RF
- Tem
- Hum
- b_PR
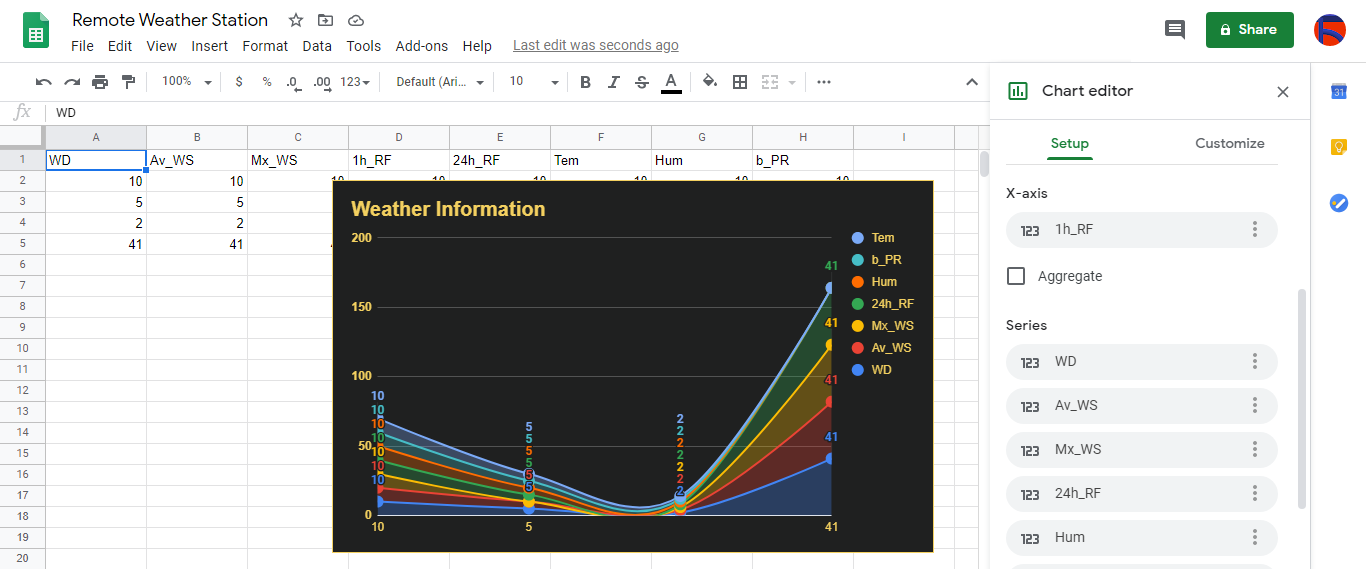
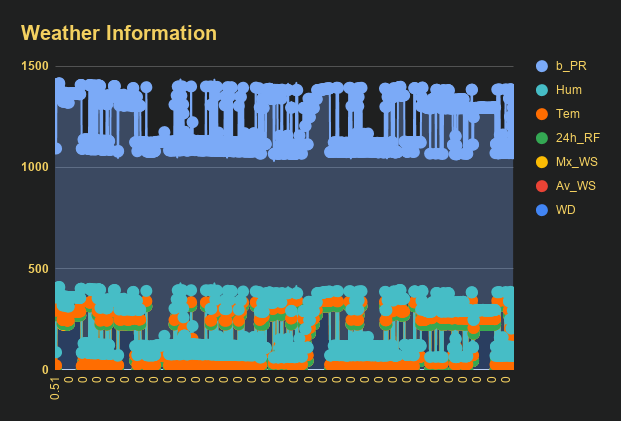
⭐ Pas indien nodig een kaart aan om de verzamelde gegevens te inspecteren, net als ik.
Stap 3:Een webtoepassing in PHP ontwikkelen om weergegevens aan de spreadsheet toe te voegen
Deze PHP-webtoepassing is bedoeld om weergegevens te krijgen die worden overgedragen door de ontwikkelborden (ESP8266 en SIM808) via een HTTP Get-verzoek en om die gegevens toe te voegen aan een gegeven spreadsheet (op ID) op Google Spreadsheets met geverifieerde inloggegevens en token.
De webtoepassing vereist de Google Client Library voor PHP om weergegevens toe te voegen aan een gegeven spreadsheet op Google Spreadsheets.
⭐ Maak dus eerst een map met de naam remote_weather_station in uw server en installeer de Google Client Library voor PHP daarin.
Het remote_weather_station map moet deze vier bestanden naast de Google Client Library bevatten om te kunnen werken:
- index.php
- account_verification_token.php
- credentials.json (Stap 2.1)
- token.json (Stap 3.1)
In deze stap zal ik de eerste twee bestanden bespreken - index.php en account_verification_token.php:
💻 index.php
⭐ Krijg lokale weergegevens van het weerstation via een Get-verzoek:
// Windrichting (wd), gemiddelde windsnelheid (a_ws), maximale windsnelheid (m_ws), 1 uur regenval (1_rf), 24 uur regenval (24_rf), temperatuur (tem), vochtigheid (hum), Luchtdruk (b_pr).
$variables_from_module;
if(isset($_GET['wd']) &&isset($_GET['a_ws']) &&isset($_GET['m_ws'] ) &&isset($_GET['1_rf']) &&isset($_GET['24_rf']) &&isset($_GET['tem']) &&isset($_GET['hum']) &&isset($_GET ['b_pr'])){
$variables_from_module =[
"wd" => (int)$_GET['wd'],
"a_ws" => (float)$_GET ['a_ws'],
"m_ws" => (float)$_GET['m_ws'],
"1_rf" => (float)$_GET['1_rf'],
"24_rf" => (float)$_GET['24_rf'],
"tem" => (float)$_GET['tem'],
"hum" => (int)$_GET ['hum'],
"b_pr" => (float)$_GET['b_pr']
];
}else{
$variables_from_module =[
"wd" => "err",
"a_ws" => "err",
"m_ws" => "err",
"1_rf" => "err",
"24_rf" => "err",
"tem" => "err",
"hum" => "err",
"b_pr" => "err"
];
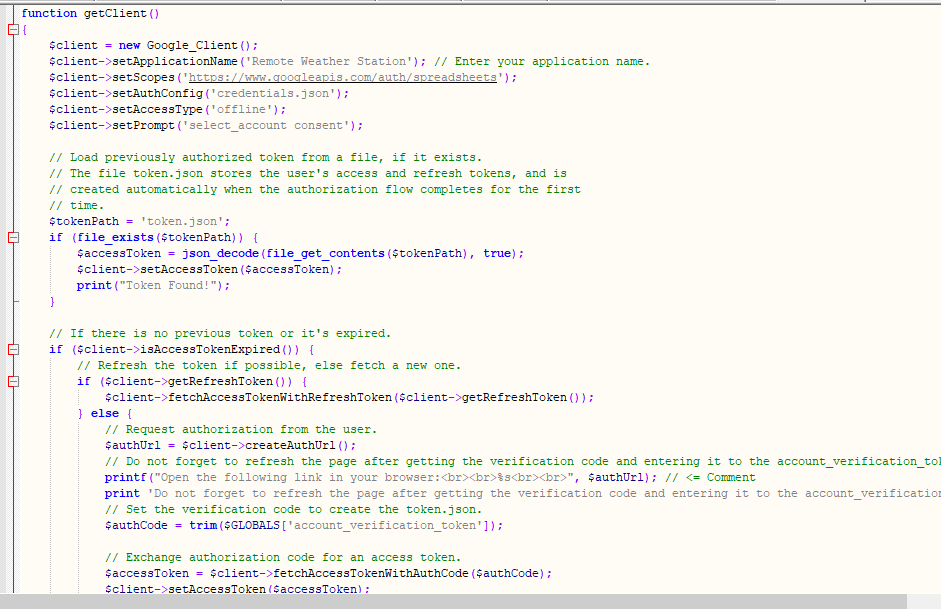
} ⭐ Maak verbinding met de Google Developer Console-toepassing met de naam Remote Weather Station door de credentials.json . te gebruiken bestand (Stap 2.1) .
$client =nieuwe Google_Client();
 $client->setApplicationName('Extern weerstation'); // Voer de naam van uw toepassing in.
 $client->setScopes('https://www.googleapis.com/auth/spreadsheets');
 $client->setAuthConfig('credentials.json');
 $client->setAccessType('offline');
 $client->setPrompt('select_account consent');
⭐ Laad eerder geautoriseerde token uit een bestand (token.json ), als deze bestaat.
$tokenPath ='token.json';
 if (file_exists($tokenPath)) {
 $accessToken =json_decode(file_get_contents($tokenPath), true);
 $client->setAccessToken($accessToken);
 print("Token Found!");
 }
⭐ Als er geen eerdere token is of is verlopen, vraagt u autorisatie aan bij de gebruiker en stelt u de verificatiecode in om de token.json te maken bestand met de file_put_contents() functie.
if ($client->isAccessTokenExpired()) {
// Ververs de token indien mogelijk, anders haal je een nieuwe op.
if ($client->getRefreshToken()) {
$client->fetchAccessTokenWithRefreshToken($client->getRefreshToken());
} else {
// Verzoek autorisatie van de gebruiker.
$authUrl =$client->createAuthUrl ();
...
// Stel de verificatiecode in om de token.json te maken.
$authCode =trim($GLOBALS['account_verification_token'' ]);
...
// Controleer of er een fout is opgetreden en of het account_verification_token is ingevoerd.
if (array_key_exists('error', $accessToken)) {
throw new Exception(join(', ', $accessToken));
}else{
print("Succesvol! Ververs de pagina.");
}
}
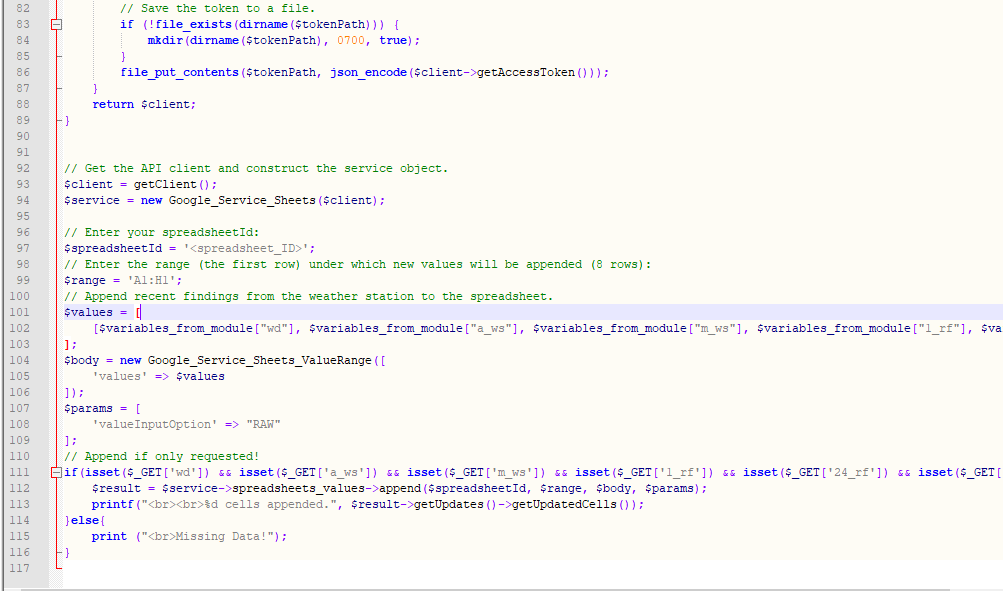
// Sla het token op in een bestand.
if (!file_exists(dirname($tokenPath))) {
mkdir(dirname($tokenPath), 0700 , true);
}
file_put_contents($tokenPath, json_encode($client->getAccessToken()));
} ⭐ Voer de spreadsheet-ID en het bereik in om recente bevindingen van het weerstation aan de spreadsheet toe te voegen.
https://docs.google.com/spreadsheets/d/spreadsheetId/edit#gid=0
// Voer uw spreadsheetId:
$spreadsheetId ='';
// Voer het bereik in (de eerste rij) waaronder nieuwe waarden worden toegevoegd (8 rijen) :
$range ='A1:H1';
// Voeg recente bevindingen van het weerstation toe aan de spreadsheet.
$values =[
[$variables_from_module["wd" ], $variables_from_module["a_ws"], $variables_from_module["m_ws"], $variables_from_module["1_rf"], $variables_from_module["24_rf"], $variables_from_module["tem"], $variables_from_module["hum $variables_from_module["b_pr"]]
];
$body =new Google_Service_Sheets_ValueRange([
'values' => $values
]);
$params =[
'valueInputOption' => "RAW"
];
...
$result =$service->spreadsheets_values->append( $spreadsheetId, $range, $body, $params);
printf("
%d cellen toegevoegd.", $result->getUpdates()->getUpdatedCells()); 💻 account_verification_token.php
⭐ Na autorisatie van de webapplicatie door de aangemaakte AuthUrl , voer de gegeven verificatiecode in om een toegangstoken in te stellen.
$account_verification_token =""; // Voer de verificatiecode in na autorisatie.
Stap 3.1:De webapplicatie instellen op Raspberry Pi (of een andere server)
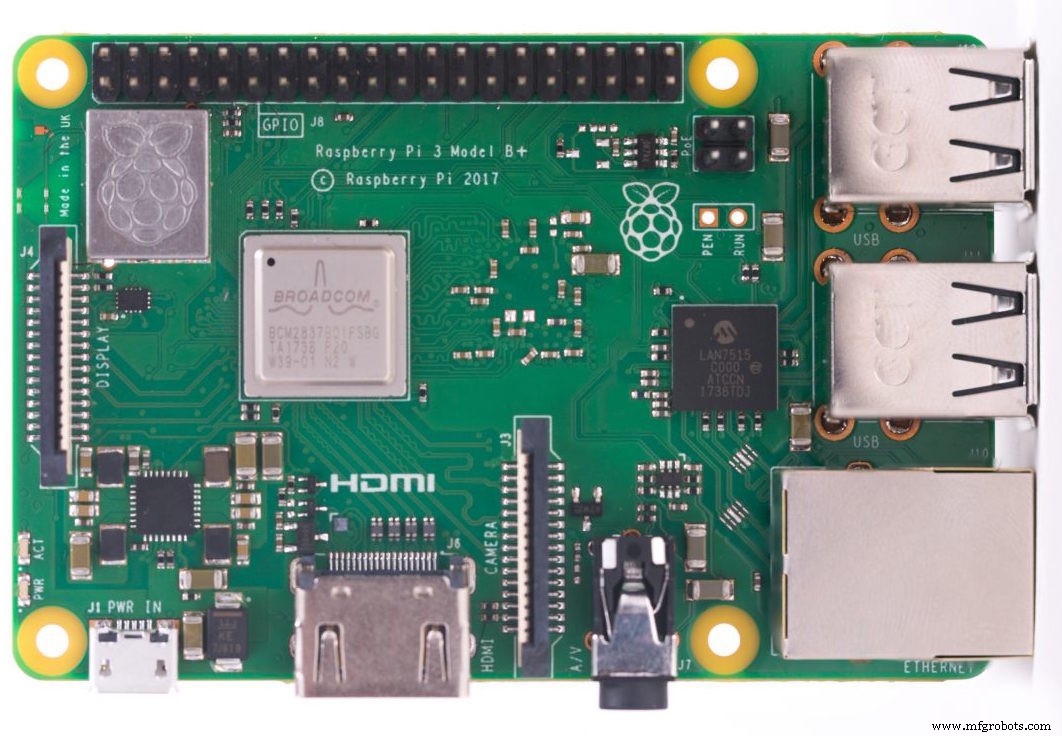
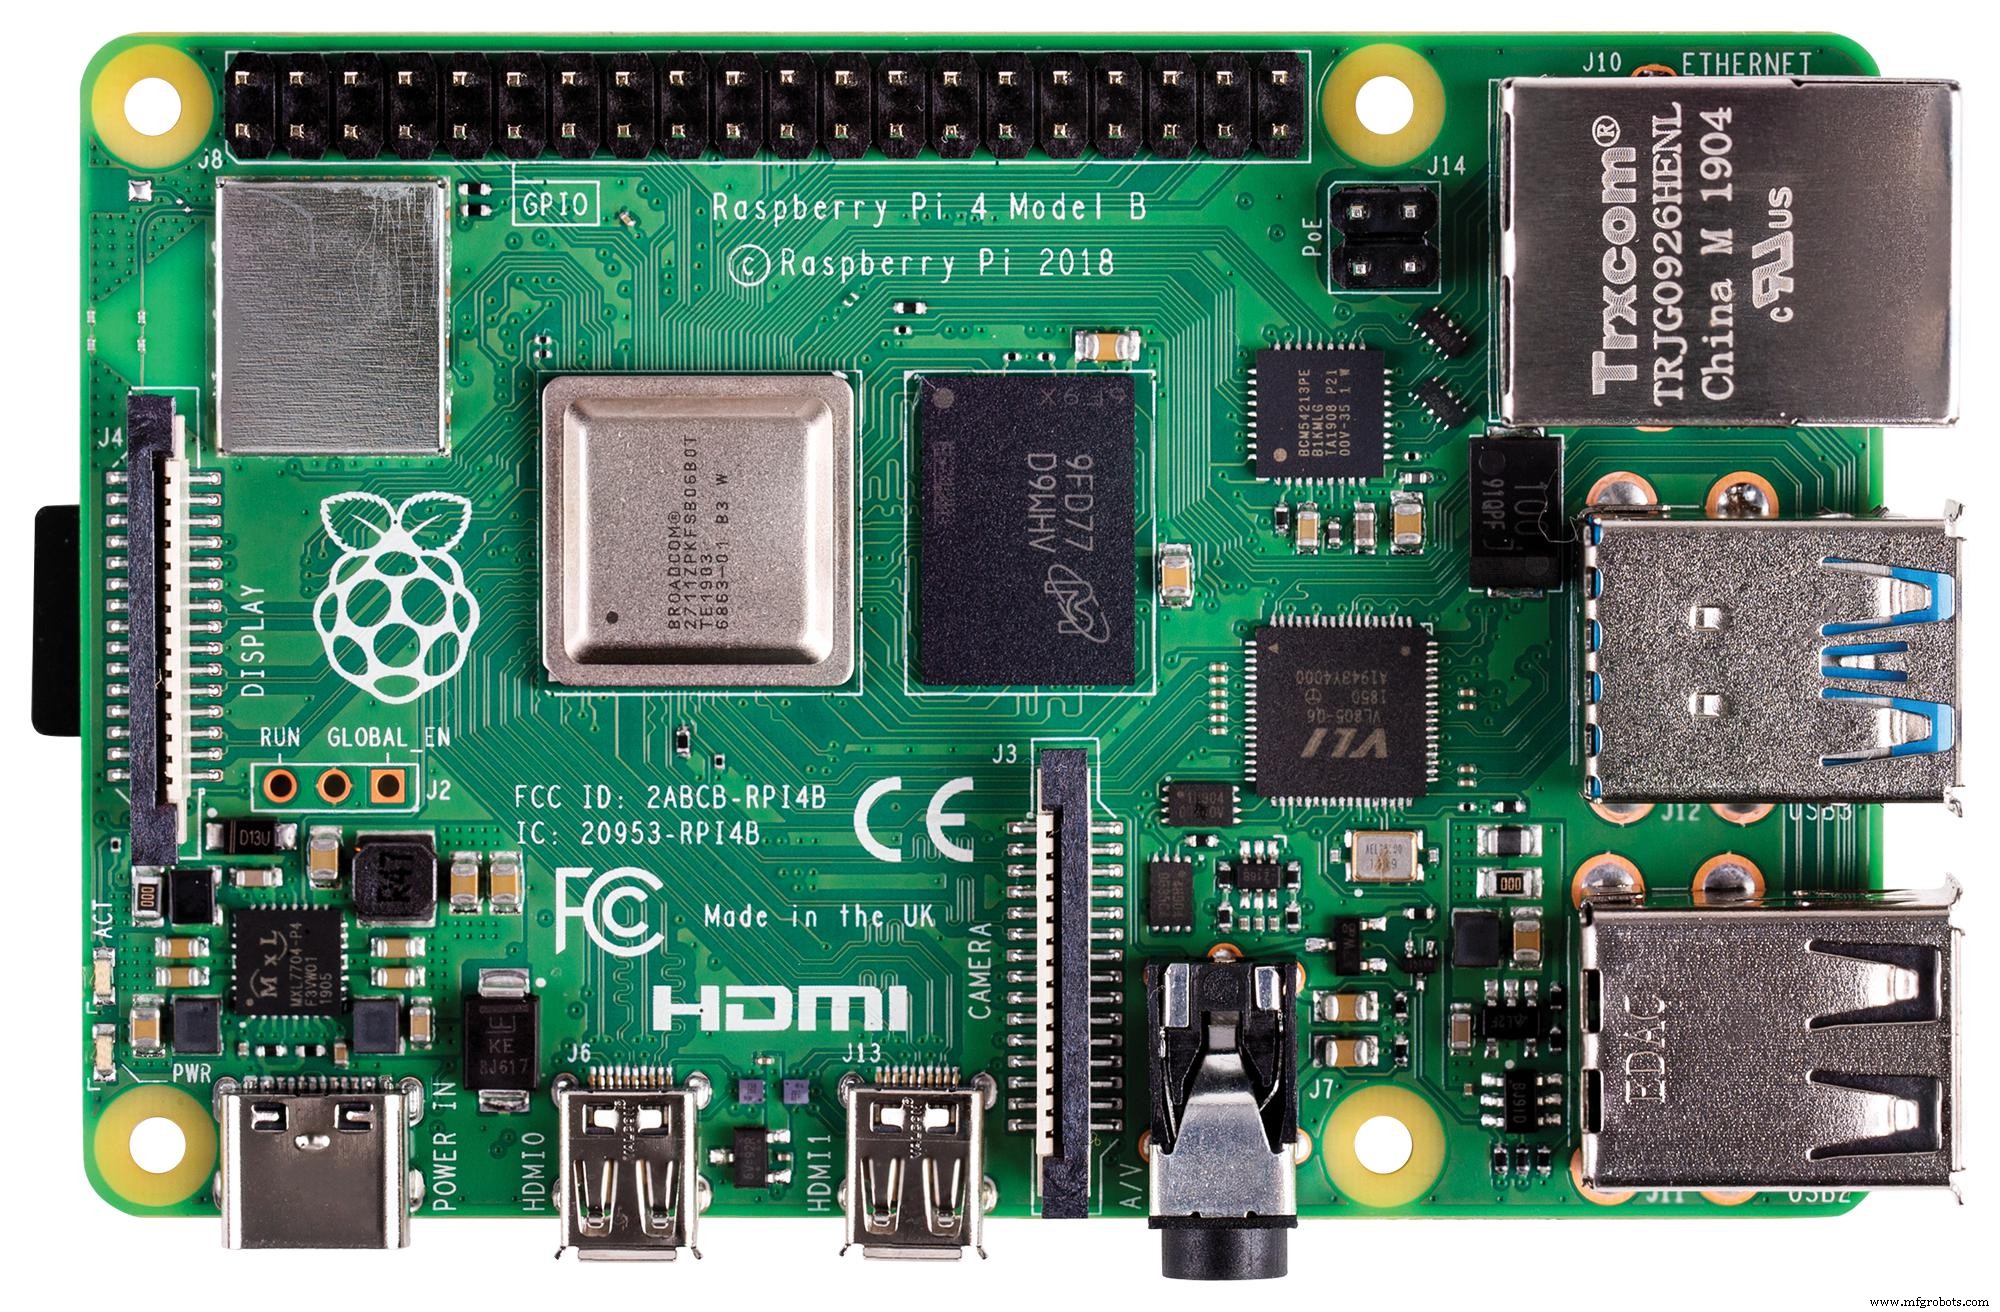
Nadat ik de PHP-webtoepassing had gemaakt, besloot ik deze op mijn Raspberry Pi uit te voeren, maar u kunt de toepassing op elke server uitvoeren, zolang het maar een PHP-server is.
Als je Raspberry Pi wilt gebruiken maar niet weet hoe je een LAMP-webserver op Raspberry Pi moet instellen, kun je deze tutorial bekijken.
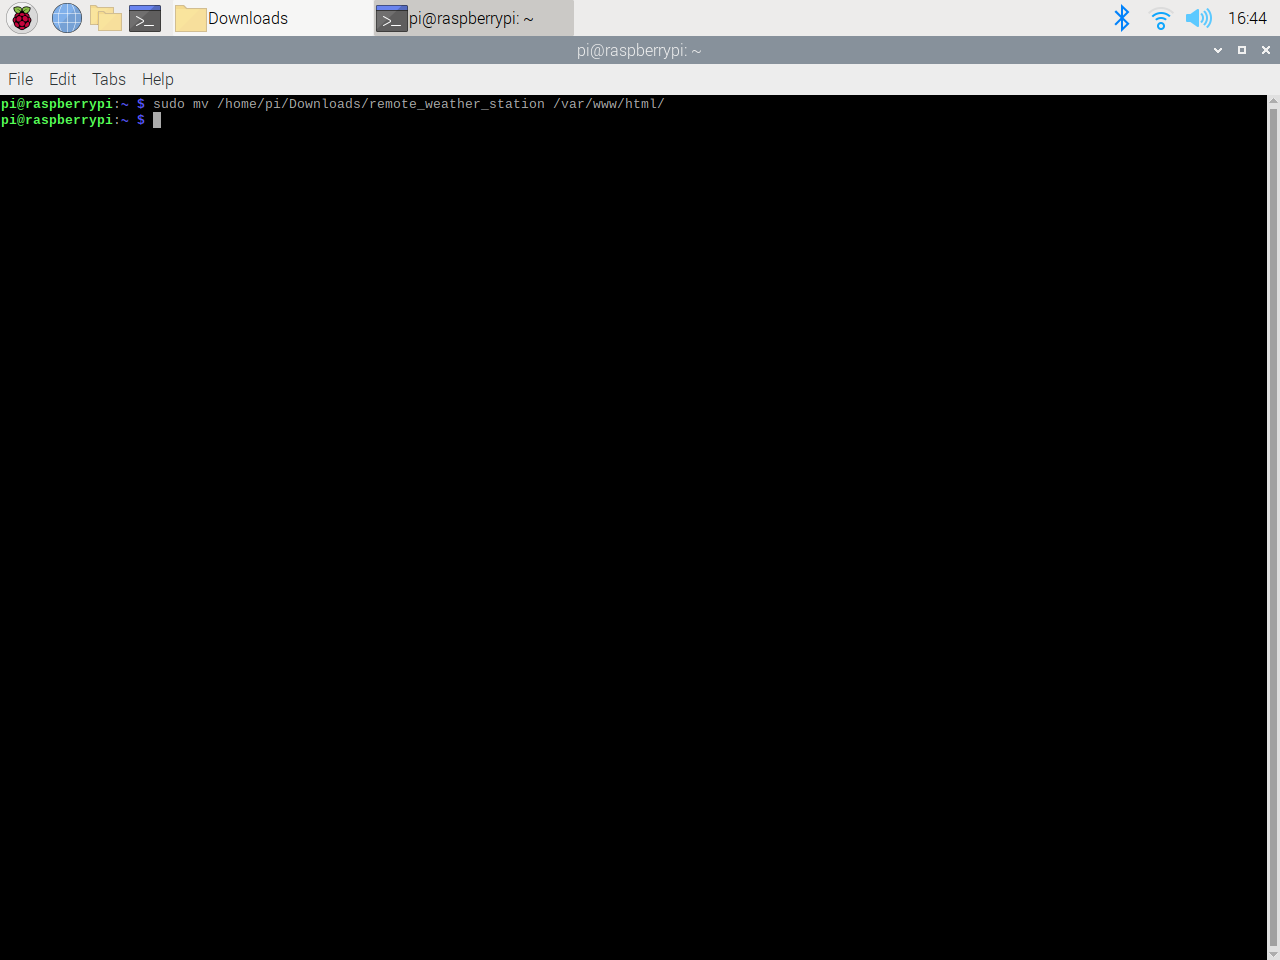
⭐ Verplaats eerst de applicatiemap (remote_weather_station) naar de apache-server (/var/www/html) met behulp van de terminal, aangezien de apache-server een beveiligde locatie is.
sudo mv /home/pi/Downloads/remote_weather_station /var/www/html/
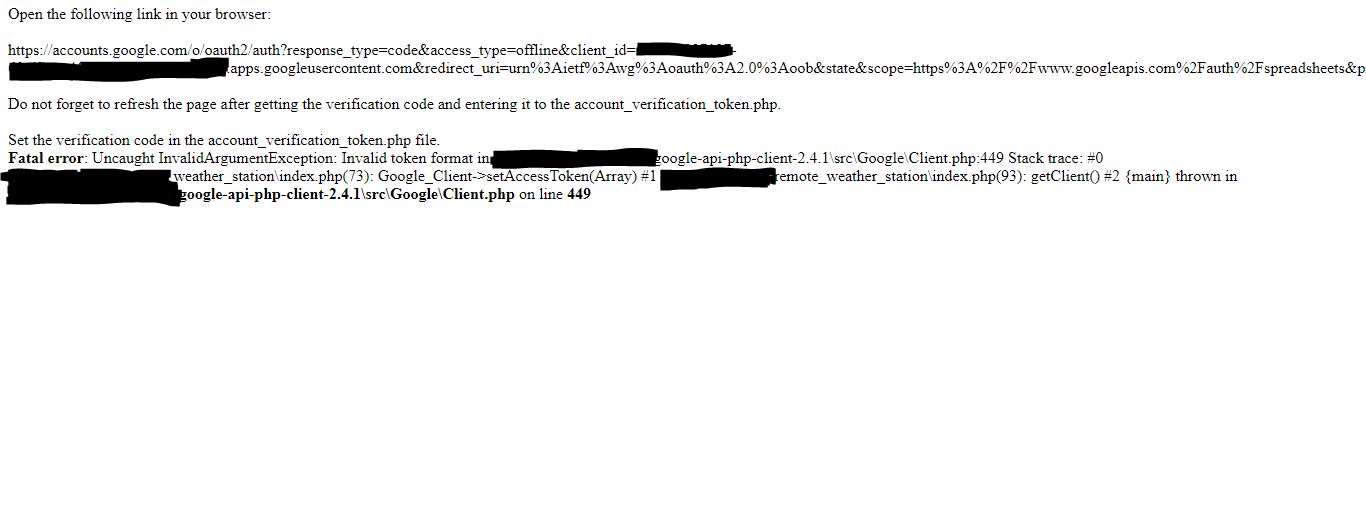
⭐ De webapplicatie geeft een foutmelding bij de eerste keer openen vanwege de ontbrekende verificatiecode. Ga naar de door de applicatie gegenereerde autorisatielink om de verificatiecode te verkrijgen.
⭐ Klik vervolgens op Ga naar extern weerstation (onveilig) .
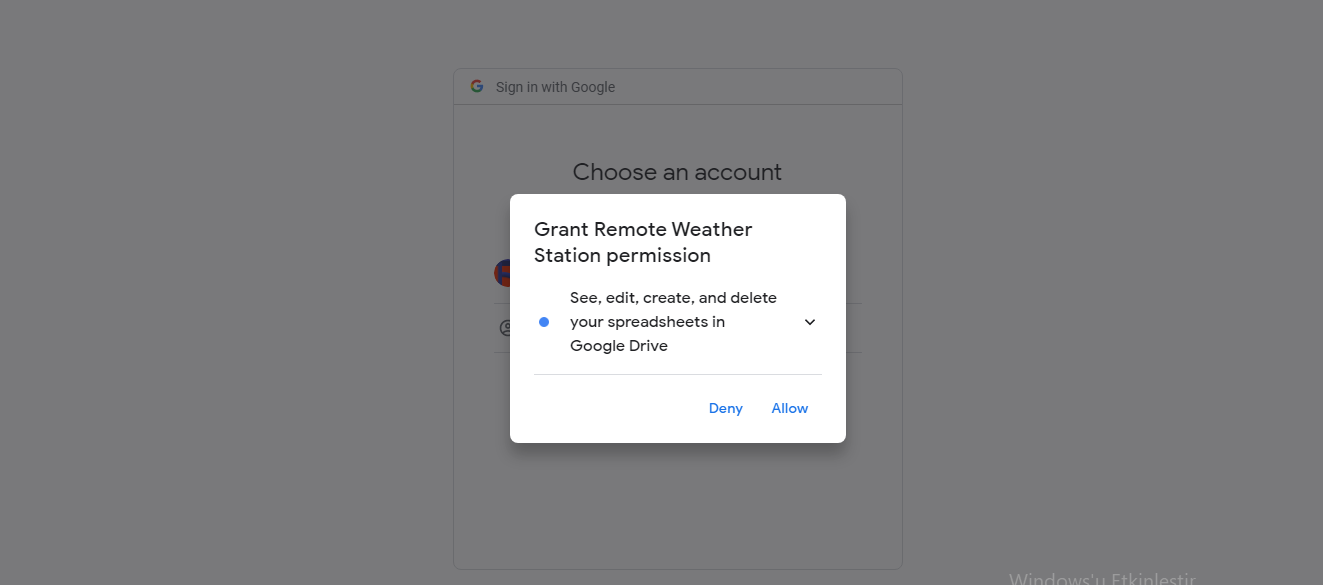
⭐ Verleen de applicatie de vereiste rechten.
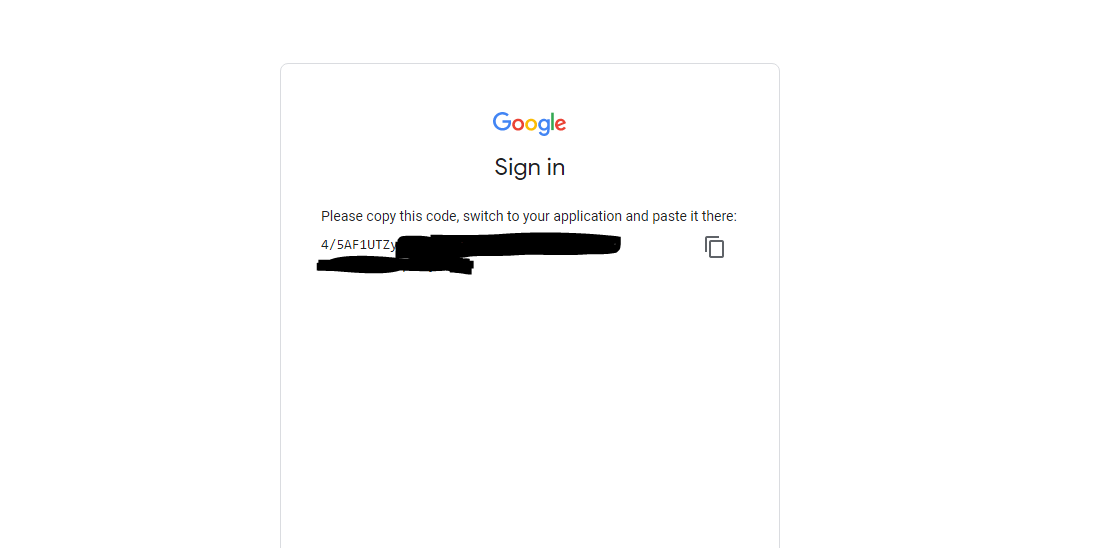
⭐ Kopieer nu de verificatiecode en plak deze in account_verification_token.php .
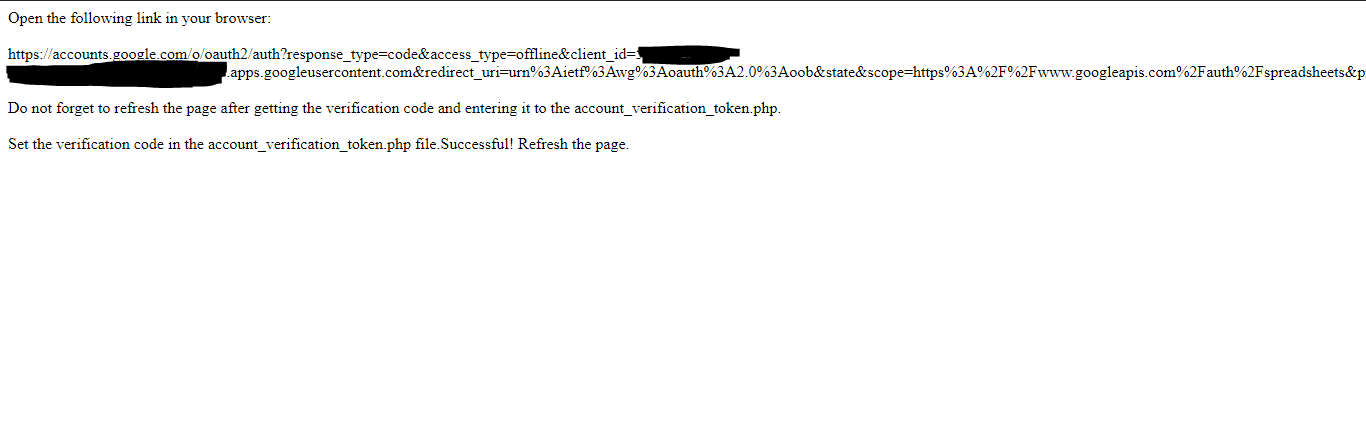
⭐ Keer terug naar de webapplicatie. Het zou het bevestigingsbericht moeten weergeven:Succesvol! Ververs de pagina .
⭐ Na het vernieuwen van de pagina gebruikt de webtoepassing de verificatiecode om een toegangstoken te krijgen en slaat het toegangstoken op in een bestand met de naam token.json . Het geeft dus niet opnieuw een fout.

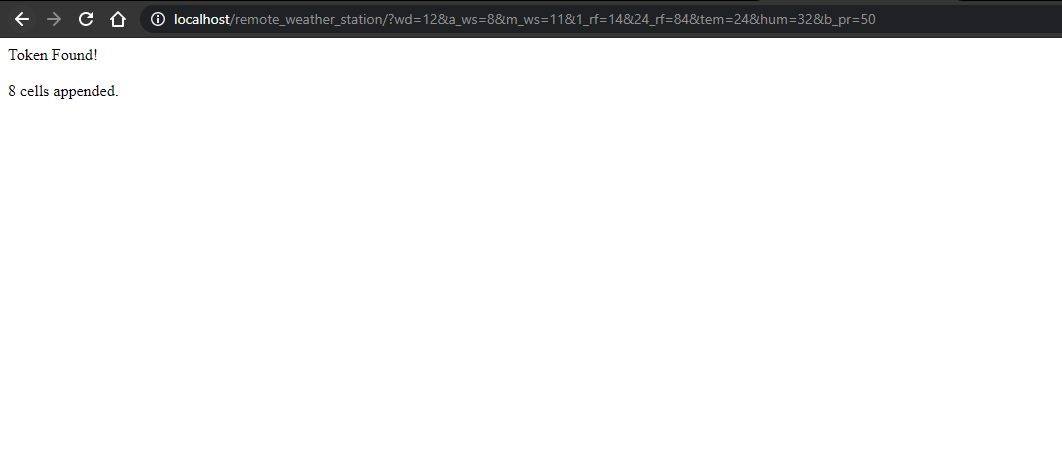
⭐ Om te testen of de PHP-webtoepassing nieuwe gegevens nauwkeurig aan de gegeven spreadsheet toevoegt:
http://localhost/remote_weather_station/?wd=12&a_ws=8&m_ws=11&1_rf=14&24_rf=84&tem=24&hum=32&b_pr=57
Stap 4:Weergegevens lezen en verzenden met ESP8266 (WiFi)
Om weergegevens op mijn balkon te verzamelen, heb ik een NodeMCU ESP-12E (ESP8266) ontwikkelbord met het weerstation gebruikt.
Ik heb het geprogrammeerd om elke vijf minuten weergegevens naar de PHP-webtoepassing te sturen.

⭐ Voeg de vereiste bibliotheken toe en definieer de wifi-instellingen.
#include
#include
#include
#include
 #include

// Definieer uw wifi-instellingen.
const char *ssid ="";
const char *password =" ";
⭐ Definieer de instellingen van het weerstation en de seriële verbindingspinnen - D6, D5.
// Definieer de instellingen van het weerstation:
char databuffer[35];
dubbele temp;
int transfering =0;

// Definieer de seriële verbindingspennen - RX en TX.
SoftwareSerial Serial_1(D6, D5); // (Rx, Tx)
⭐ In de getBuffer() functie, ontvang gegevens van het weerstation.
void getBuffer(){
int index;
for (index =0;index <35;index ++){
if(Serial_1.available()){
databuffer[index] =Serial_1.read();
if (databuffer[0] !='c'){
index =-1;
}
}
else{
index --;
}
}
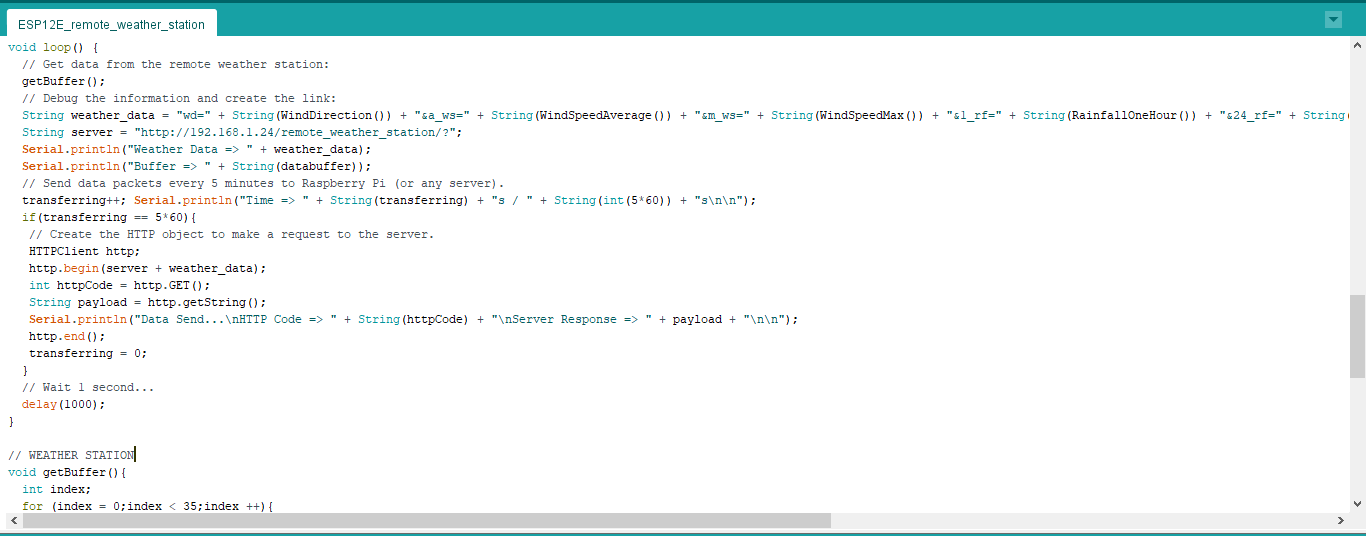
} ⭐ Debug de weergegevens en maak de link.
String weather_data ="wd=" + String(WindDirection()) + "&a_ws=" + String(WindSpeedAverage()) + "&m_ws=" + String(WindSpeedMax()) + "&1_rf=" + String(RainfallOneHour()) + "&24_rf=" + String(RainfallOneDay()) + "&tem=" + String(Temperature()) + "&hum=" + String(Vochtigheid()) + "&b_pr=" + String( BarPressure());
String server ="http://192.168.1.24/remote_weather_station/?";

...

int WindDirection(){ retourneer transCharToInt(databuffer,1,3); } // Windrichting (deg)

float WindSpeedAverage(){ temp =0.44704 * transCharToInt(databuffer,5,7); retourtemperatuur; } // Gemiddelde luchtsnelheid (1 minuut)

float WindSpeedMax(){ temp =0.44704 * transCharToInt(databuffer,9,11); retourtemperatuur; } //Max. luchtsnelheid (5 minuten)

float Temperature(){ temp =(transCharToInt(databuffer,13,15) - 32,00) * 5,00 / 9,00; retourtemperatuur; } // Temperatuur ("C")

float RainfallOneHour(){ temp =transCharToInt(databuffer,17,19) * 25.40 * 0.01; retourtemperatuur; } // Neerslag (1 uur)

float RainfallOneDay(){ temp =transCharToInt(databuffer,21,23) * 25.40 * 0.01; retourtemperatuur; } // Neerslag (24 uur)

int Vochtigheid(){ return transCharToInt(databuffer,25,26); } // Vochtigheid (%)

float BarPressure(){ temp =transCharToInt(databuffer,28,32); retourtemp / 10.00; } // Luchtdruk (hPA)
⭐ Stuur elke 5 minuten datapakketten naar Raspberry Pi (of een willekeurige server).
overzetten++; Serial.println("Time => " + String(overdragen) + "s / " + String(int(5*60)) + "s\n\n");
if(overdragen ==5* 60){
// Maak het HTTP-object om een verzoek aan de server te doen.
HTTPClient http;
http.begin(server + weather_data);
int httpCode =http.GET();
String-payload =http.getString();
Serial.println("Data Send...\nHTTP Code => " + String(httpCode) + "\nServer Response => " + payload + "\n\n");
http.end();
overzetten =0;
}
// Wait 1 second...
delay(1000);
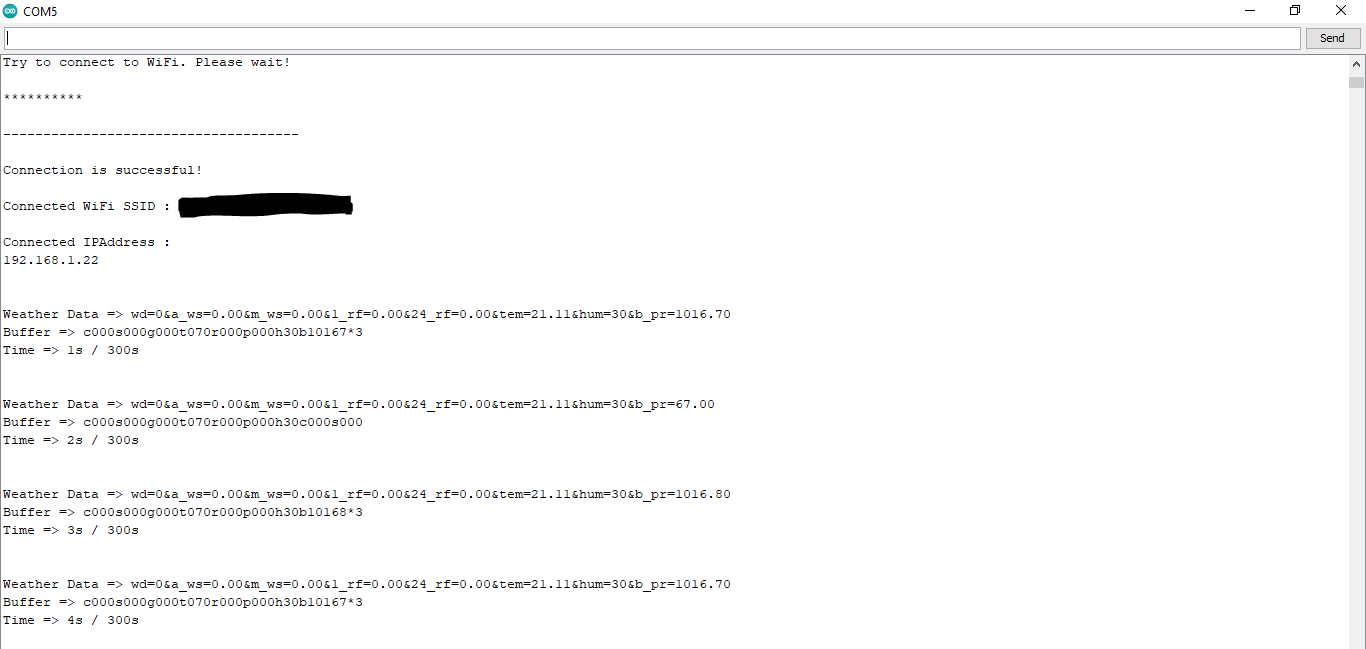
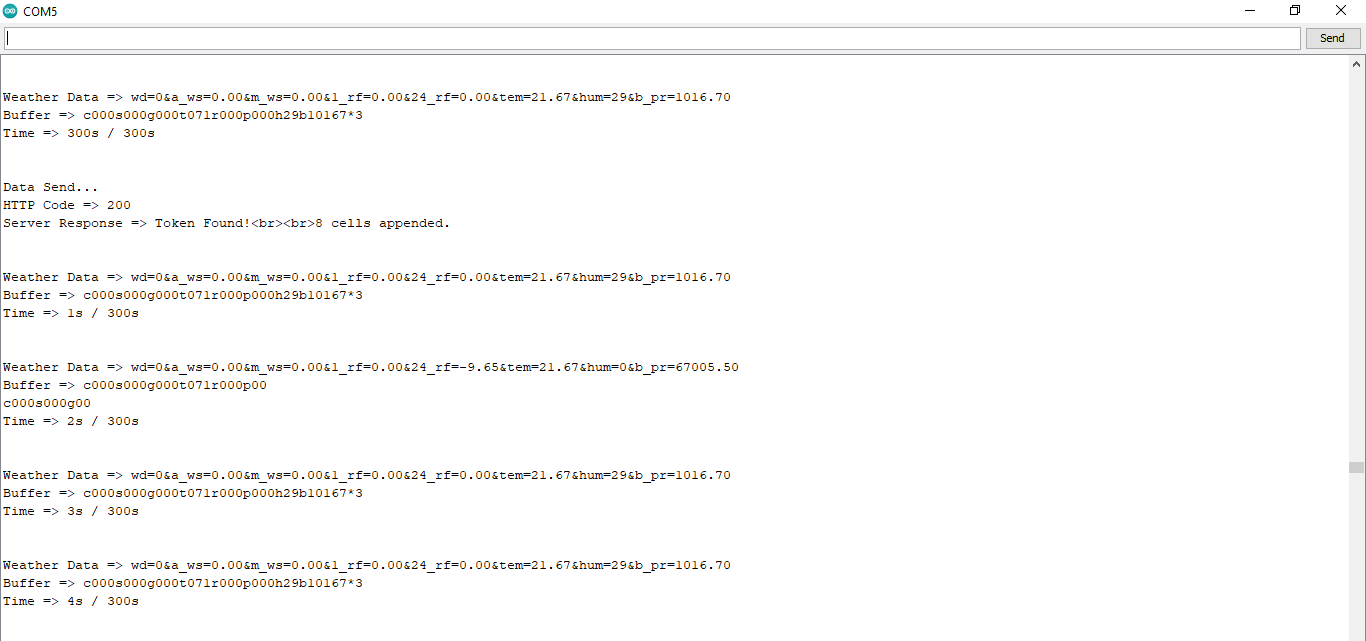
⭐ After uploading the code to the NodeMCU ESP-12E (ESP8266) development board, it displays weather data every second on the serial monitor and sends data packets every five minutes (300 seconds) to the PHP web application.
Connection is successful!

...

Weather Data => wd=0&a_ws=0.00&m_ws=0.00&1_rf=0.00&24_rf=0.00&tem=21.67&hum=29&b_pr=1016.70
Buffer => c000s000g000t071r000p000h29b10167*3
Time => 299s / 300s


Weather Data => wd=0&a_ws=0.00&m_ws=0.00&1_rf=0.00&24_rf=0.00&tem=21.67&hum=29&b_pr=1016.70
Buffer => c000s000g000t071r000p000h29b10167*3
Time => 300s / 300s

...
⭐ Then, it shows the response from the server.
...

Data Send...
HTTP Code => 200
Server Response => Token Found!

8 cells appended.

...
Step 4.1:Reading and sending weather data with SIM808 (GPRS)
To collect weather data in my backyard, I used a SIM808 shield for Arduino Uno if the distance between the weather station and my router is too far away.
Most of the code is the same and covered in the previous step aside from the parts below.
⭐ Include required libraries and define the sim808 object.
For SIM808 GPS/GPRS/GSM Shield | Download
#include
#include

// Define the sim808.
DFRobot_SIM808 sim808(&Serial);
⭐ Initialize the SIM808 module and continue if it is working accurately.
//******** Initialize sim808 module *************
 while(!sim808.init()) {
 delay(1000);
 Serial.print("Sim808 init error\r\n");
 }
 delay(2000);
 // Continue if the SIM808 Module is working accurately.
 Serial.println("Sim808 init success");
 delay(5000);
⭐ Send data packets every 5 minutes to the server by establishing a TCP connection to make a GET request.
transferring++; Serial.println("Time => " + String(transferring) + "s / " + String(int(5*60)) + "s\n\n");
if(transferring ==5*60){
//*********** Attempt DHCP *******************
while(!sim808.join(F("cmnet"))) {
Serial.println("Sim808 join network error!");
delay(2000);
}
//************ Successful DHCP ****************
delay(5000);
Serial.println("Successful DHCP");
//*********** Establish a TCP connection ************
if(!sim808.connect(TCP,"192.168.1.24", 80)) { // Change it with your server.
Serial.println("Connection Error");
}else{
Serial.println("Connection OK");
}
delay(2000);
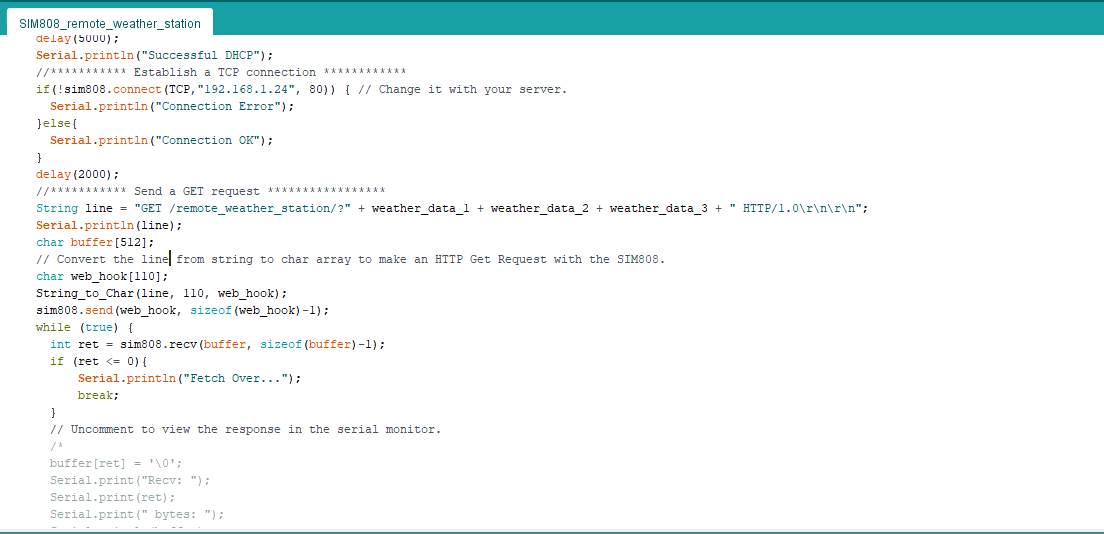
... ⭐ After creating the line string, convert it from string to char array to make an HTTP Get Request with the SIM808.
...

 String line ="GET /remote_weather_station/?" + weather_data_1 + weather_data_2 + weather_data_3 + " HTTP/1.0\r\n\r\n";
 Serial.println(line);
 char buffer[512];
 // Convert the line from string to char array to make an HTTP Get Request with the SIM808.
 char web_hook[110];
 String_to_Char(line, 110, web_hook);
 sim808.send(web_hook, sizeof(web_hook)-1);
 while (true) {
 int ret =sim808.recv(buffer, sizeof(buffer)-1);
 if (ret <=0){
 Serial.println("Fetch Over...");
 break;
 }

 ...
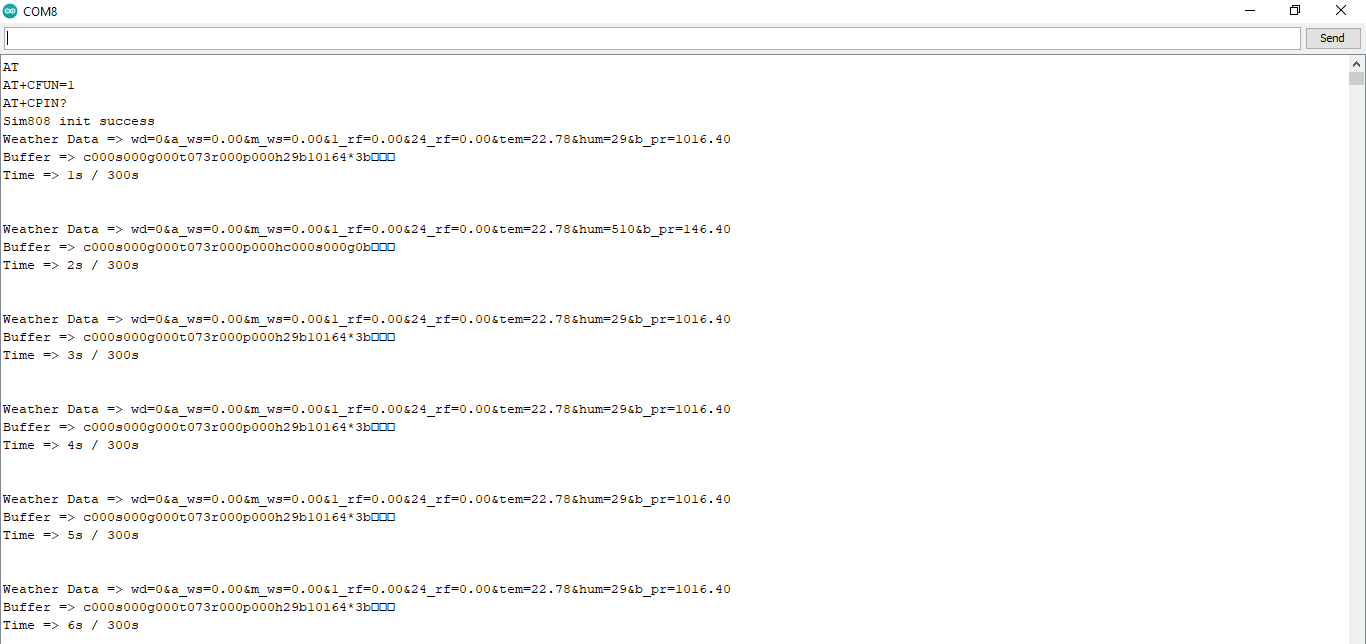
⭐ After uploading the code to the SIM808 shield, it displays weather data every second on the serial monitor and sends data packets every five minutes (300 seconds) to the PHP web application.
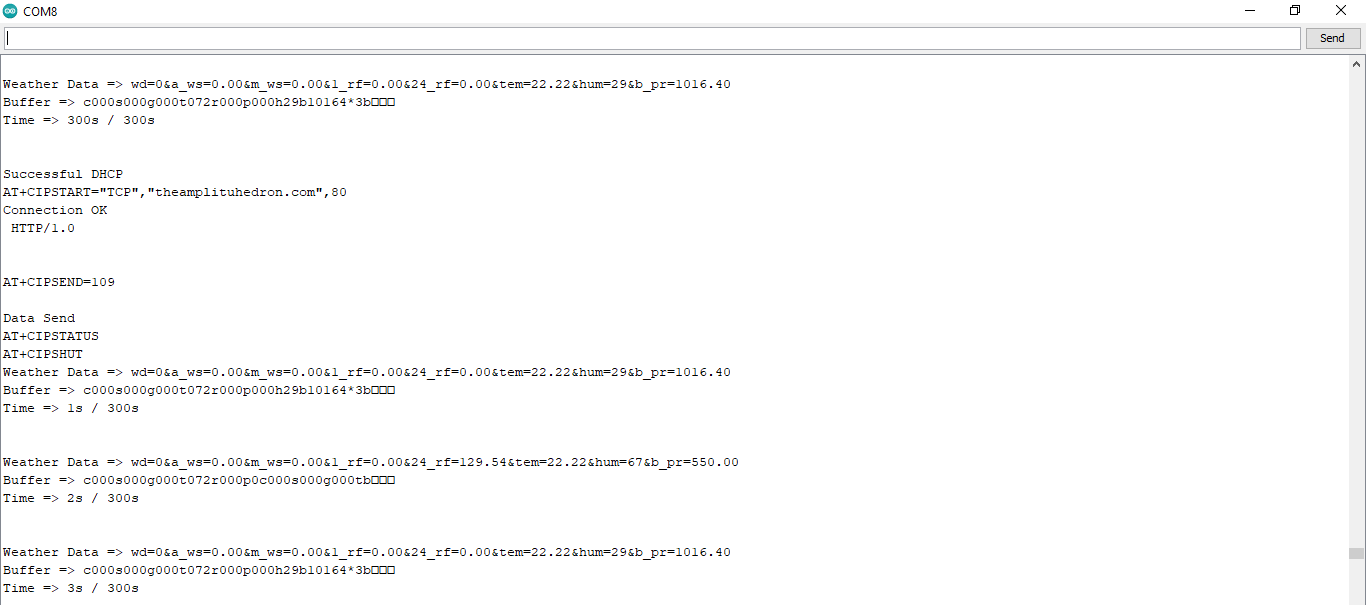
Step 4.2:Creating the weather data set for more than three months
After finishing coding, I started to collate weather data on Google Sheets every five minutes for more than three months to build a neural network model and make predictions on the rainfall intensity.
Collected Weather Data:
- Wind Direction (deg)
- Average Wind Speed (m/s)
- Max Wind Speed (m/s)
- One-Hour Rainfall (mm)
- 24-Hours Rainfall (mm)
- Temperature (°C)
- Humidity (%)
- Barometric Pressure (hPa)
Then, I downloaded the spreadsheet as Remote Weather Station.csv , consisting of 32219 rows as my preliminary local weather data set. I am still collating weather data to improve my data set and model :)
Step 5:Building an Artificial Neural Network (ANN) with TensorFlow
When I completed collating my preliminary local weather data set, I started to work on my artificial neural network (ANN) model to make predictions on the rainfall intensity.
I decided to create my neural network model with TensorFlow in Python. So, first of all, I followed the steps below to grasp a better understanding of the weather data:
- Data Visualization
- Data Scaling (Normalizing)
- Data Preprocessing
- Data Splitting
After applying these steps, I decided to use my neural network model to classify different rainfall intensity classes theoretically assigned as labels (outputs) for each input (row). I created my classes according to the rate of precipitation, which depends on the considered time.
The following categories are used to classify rainfall intensity by the rate of precipitation (rainfall):
- Light rain — when the precipitation rate is <2.5 mm per hour
- Moderate rain — when the precipitation rate is between 2.5 mm and 7.6 mm per hour
- Heavy rain — when the precipitation rate is between 7.6 mm and 50 mm per hour
- Violent rain — when the precipitation rate is> 50 mm per hour
According to the precipitation (rainfall) rates, I preprocessed the weather data to assign one of these five classes for each input as its label:
- 0 (None)
- 1 (Light Rain)
- 2 (Moderate Rain)
- 3 (Heavy Rain)
- 4 (Violent Rain)
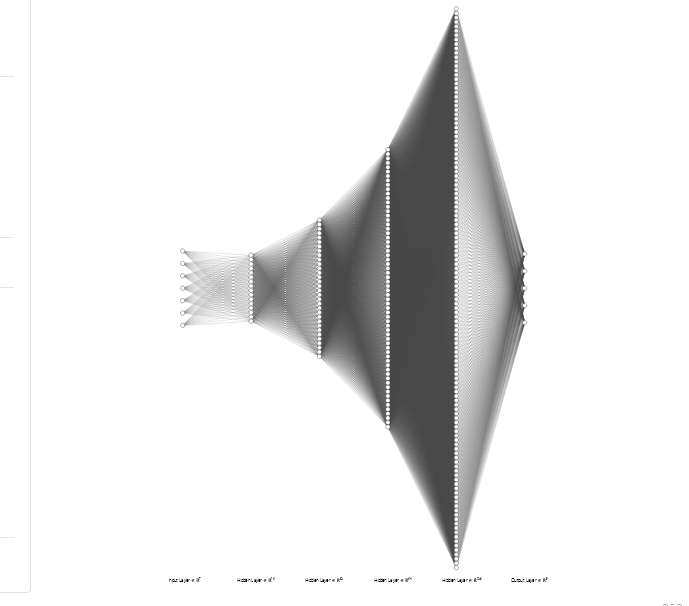
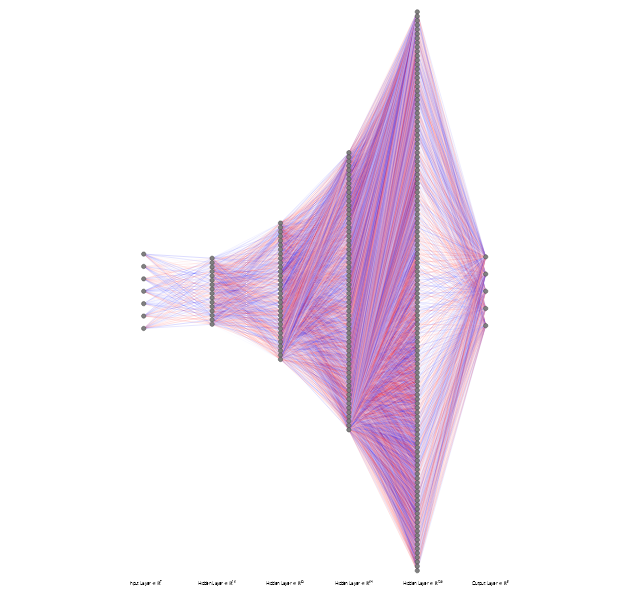
After scaling (normalizing) and preprocessing the weather data, I elicited seven input variables and one label for each reading, classified with the five mentioned classes. Then, I built an artificial neural network model with TensorFlow to obtain the best possible results and predictions with my preliminary data set.
Layers:
- 7 [Input]
- 16 [Hidden]
- 32 [Hidden]
- 64 [Hidden]
- 128 [Hidden]
- 5 [Output]
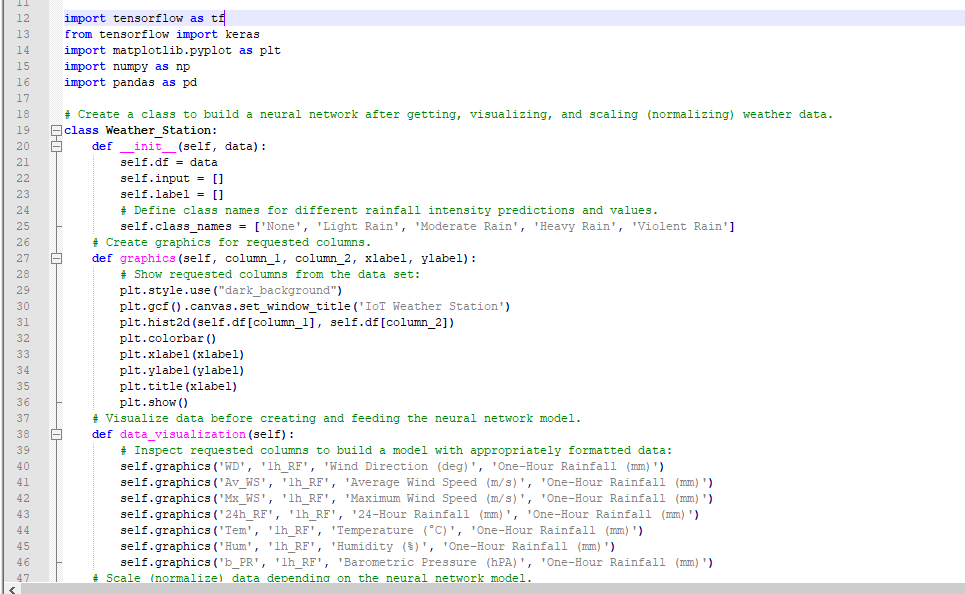
To execute all steps above, I created a class named Weather_Station in Python after including the required libraries:
import tensorflow as tf
from tensorflow import keras
import matplotlib.pyplot as plt
import numpy as np
import pandas as pd
Subsequently, I will discuss coding in Python for each step I mentioned above.
Also, you can download IoT_weather_station_neural_network.py to inspect coding.
Step 5.1:Visualizing and scaling (normalizing) the weather data
Before diving in to build a model, it is important to understand the weather data to pass the model appropriately formatted data.
So, in this step, I will show you how to visualize weather data and scale (normalize) in Python.
⭐ First of all, read the weather data from Remote Weather Station.csv .
csv_path ="E:\PYTHON\Remote Weather Station.csv"
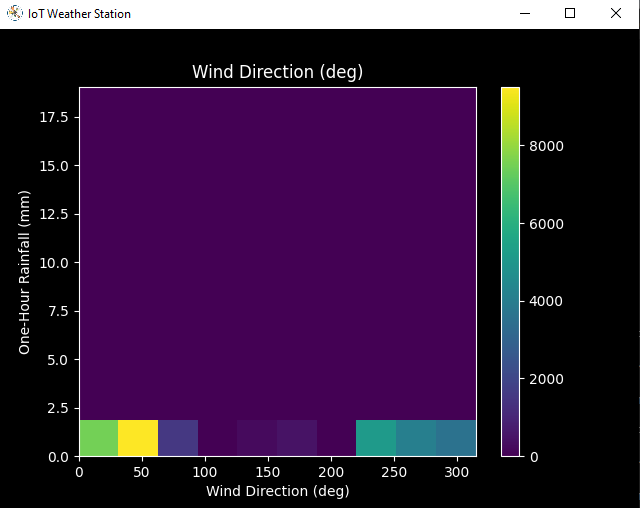
df =pd.read_csv(csv_path) ⭐ In the graphics() function, visualize the requested columns from the weather data set by using the Matplotlib library.
def graphics(self, column_1, column_2, xlabel, ylabel):
# Show requested columns from the data set:
plt.style.use("dark_background")
plt.gcf().canvas.set_window_title('IoT Weather Station')
plt.hist2d(self.df[column_1], self.df[column_2])
plt.colorbar()
plt.xlabel(xlabel)
plt.ylabel(ylabel)
plt.title(xlabel)
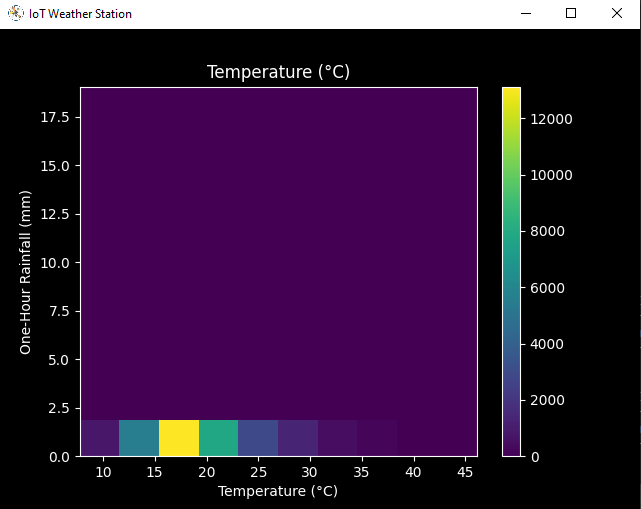
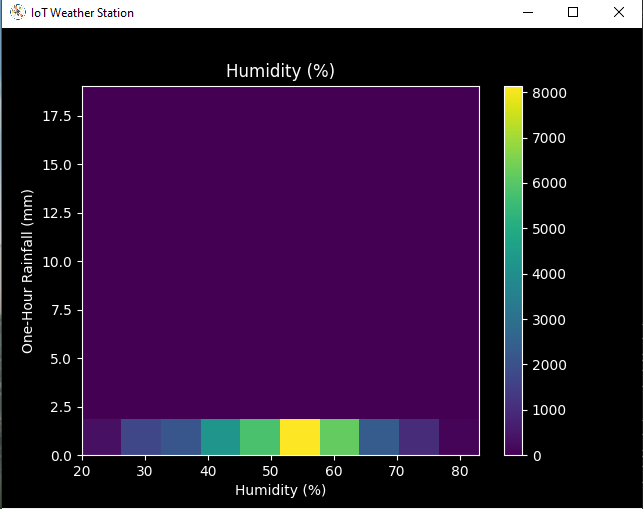
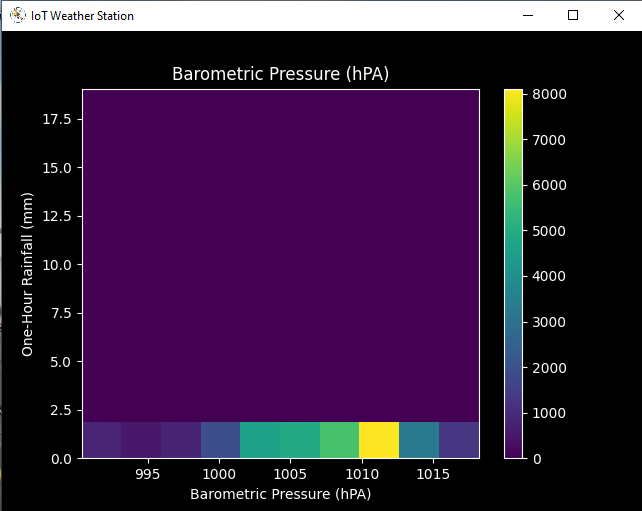
plt.show() ⭐ In the data_visualization() function, inspect all columns before scaling weather data to build a model with appropriately formatted data.
def data_visualization(self):
 # Inspect requested columns to build a model with appropriately formatted data:
 self.graphics('WD', '1h_RF', 'Wind Direction (deg)', 'One-Hour Rainfall (mm)')
 self.graphics('Av_WS', '1h_RF', 'Average Wind Speed (m/s)', 'One-Hour Rainfall (mm)')
 self.graphics('Mx_WS', '1h_RF', 'Maximum Wind Speed (m/s)', 'One-Hour Rainfall (mm)')
 self.graphics('24h_RF', '1h_RF', '24-Hour Rainfall (mm)', 'One-Hour Rainfall (mm)')
 self.graphics('Tem', '1h_RF', 'Temperature (°C)', 'One-Hour Rainfall (mm)')
 self.graphics('Hum', '1h_RF', 'Humidity (%)', 'One-Hour Rainfall (mm)')
 self.graphics('b_PR', '1h_RF', 'Barometric Pressure (hPA)', 'One-Hour Rainfall (mm)')
After visualizing weather data, I scaled (normalized) each column to format it properly.
Normally, each row (reading) looked like this before scaling:
- 315, 0.45, 0, 0.51, 0.51, 22.78, 65, 1005.5
⭐ In the scale_data() function:
⭐ The wind direction in units of degrees and angles do not make good model inputs. 360° and 0° should be close to each other and wrap around smoothly. The direction should not matter if the wind is not blowing. Thus, convert the wind direction and velocity columns to a wind vector to interpret them easily with a neural network model.
def scale_data(self):
 # Wind Direction and Speed:
 wv =self.df.pop('Av_WS')
 max_wv =self.df.pop('Mx_WS')
 # Convert to radians.
 wd_rad =self.df.pop('WD')*np.pi / 180
 # Calculate the wind x and y components.
 self.df['scaled_WX'] =wv*np.cos(wd_rad)
 self.df['scaled_WY'] =wv*np.sin(wd_rad)
 # Calculate the max wind x and y components.
 self.df['scaled_max_WX'] =max_wv*np.cos(wd_rad)
 self.df['scaled_max_WY'] =max_wv*np.sin(wd_rad)

 ...
⭐ For the remaining columns except for 1h_RF , divide them into average reading values to scale (normalize) and format.
...

 # Temperature:
 tem =self.df.pop('Tem')
 self.df['scaled_Tem'] =tem / 25
 # Humidity:
 hum =self.df.pop('Hum')
 self.df['scaled_Hum'] =hum / 70
 # Barometric Pressure:
 bPR =self.df.pop('b_PR')
 self.df["scaled_bPR"] =bPR / 1013
 # 24 Hour Rainfall (Approx.)
 rain_24 =self.df.pop('24h_RF')
 self.df['scaled_24h_RF'] =rain_24 / 24
After completing scaling (normalizing), I extracted these new columns from the weather data set:
- scaled_WX
- scaled_WY
- scaled_max_WX
- scaled_max_WY
- scaled_Tem
- scaled_Hum
- scaled_bPR
- scaled_24h_RF
Step 5.2:Training the model (ANN) on the rainfall intensity classes
Before building and training a neural network model in TensorFlow, I needed to create the input array and the label array by preprocessing the scaled and normalized weather data set.
⭐ In the create_input_and_label() function:
⭐ Firstly, append each input element as a NumPy array to the input array and convert it to a NumPy array by using the asarray() functie.
⭐ Each input element includes seven variables [shape=(7, )]:
- [scaled_WX, scaled_WY, scaled_max_WX, scaled_max_WY, scaled_Tem, scaled_Hum, scaled_bPR]
def create_input_and_label(self):
 n =len(self.df)
 # Create the input array using the scaled variables:
 for i in range(n):
 self.input.append(np.array([self.df['scaled_WX'][i], self.df['scaled_WY'][i], self.df['scaled_max_WX'][i], self.df['scaled_max_WY'][i], self.df['scaled_Tem'][i], self.df['scaled_Hum'][i], self.df['scaled_bPR'][i]]))
 self.input =np.asarray(self.input)

 ...
⭐ Then, evaluate the approximate rainfall (precipitation) rate for each reading (row).
approx_RF_rate =(1h_RF + scaled_24h_RF) * 100
⭐ According to the rainfall rate, assign a class [0 - 4] for each input element and append them to the label array.
...
for i in range(n):
_class =0
# Evaluate the approximate rainfall rate:
approx_RF_rate =(self.df['1h_RF'][i] + self.df['scaled_24h_RF'][i]) * 100
# As labels, assign classes of rainfall intensity according to the approximate rainfall rate (mm):
if approx_RF_rate ==0:
_class =0
elif approx_RF_rate <2.5:
_class =1
elif 2.5
elif 7.6
else:
_class =4
self.label.append(_class)
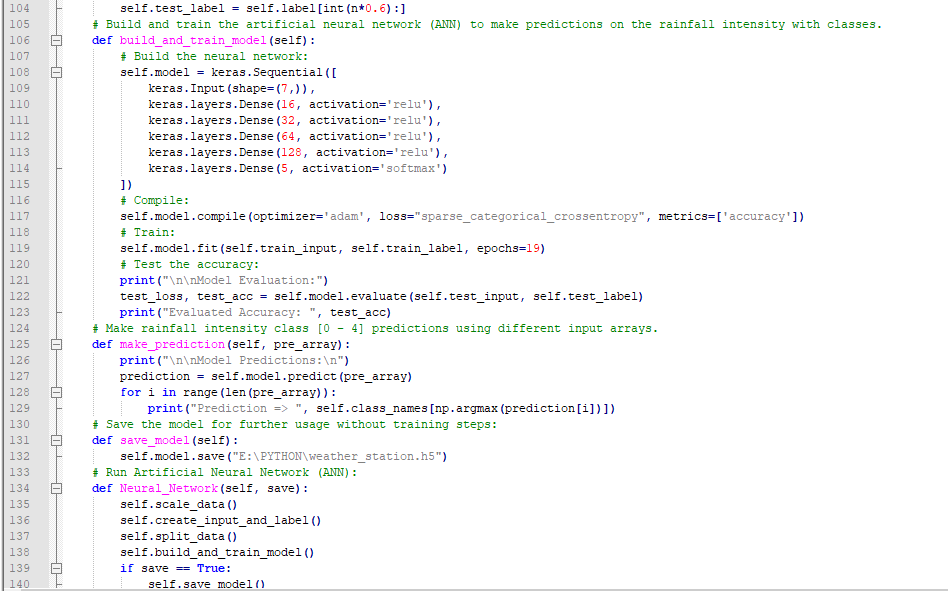
self.label =np.asarray(self.label) After preprocessing the scaled weather data to create input and label arrays, I split them as training (60%) and test (40%) data sets:
def split_data(self):
n =len(self.df)
# (60%, 40%) - (training, test)
self.train_input =self.input[0:int(n*0.6)]
self.test_input =self.input[int(n*0.6):]
self.train_label =self.label[0:int(n*0.6)]
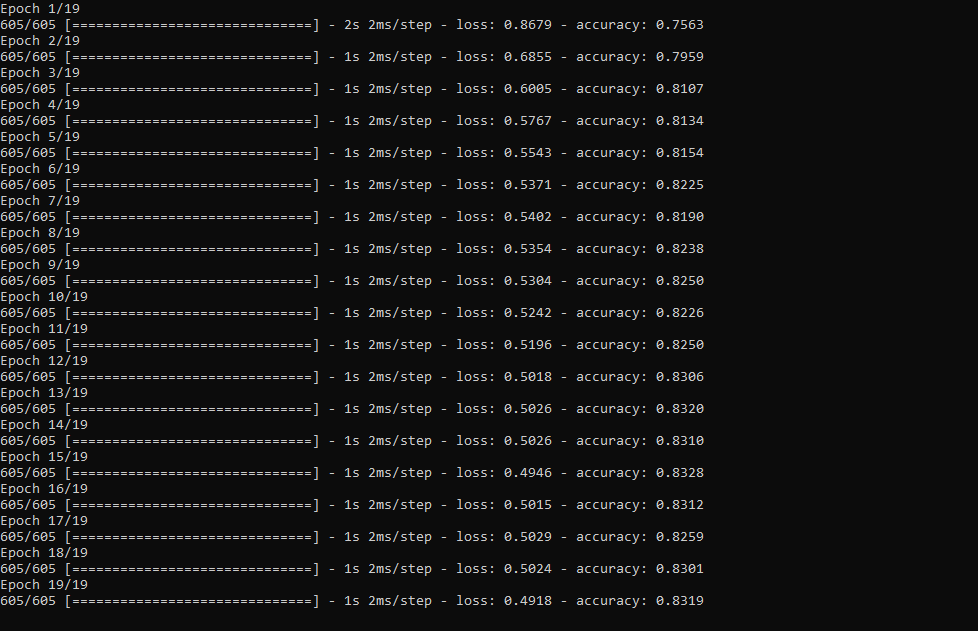
self.test_label =self.label[int(n*0.6):] Then, I built my artificial neural network (ANN) model by using Keras and trained it with the training data set for nineteen epochs.
You can inspect these tutorials to learn about activation functions, loss functions, epochs, etc.
def build_and_train_model(self):
 # Build the neural network:
 self.model =keras.Sequential([
 keras.Input(shape=(7,)),
 keras.layers.Dense(16, activation='relu'),
 keras.layers.Dense(32, activation='relu'),
 keras.layers.Dense(64, activation='relu'),
 keras.layers.Dense(128, activation='relu'),
 keras.layers.Dense(5, activation='softmax')
 ])
 # Compile:
 self.model.compile(optimizer='adam', loss="sparse_categorical_crossentropy", metrics=['accuracy'])
 # Train:
 self.model.fit(self.train_input, self.train_label, epochs=19)

 ...
After training with the preliminary training data set, the accuracy of the model is between 0.83 and 0.85 .
Step 5.3:Evaluating the model and making predictions on the rainfall intensity
After building and training my artificial neural network model, I tested its accuracy by using the preliminary testing data set.
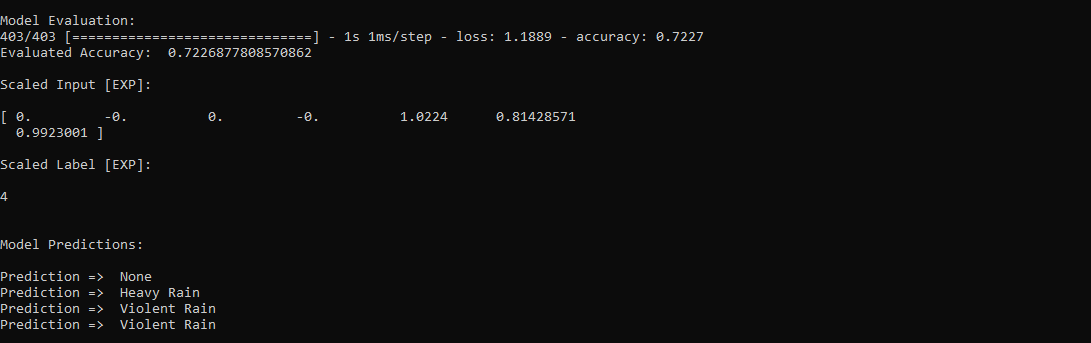
For now, the evaluated accuracy of the model is between 0.72 and 0.73 due to inadequate testing data set overfitting the model. However, I am still collecting weather data to improve the model accuracy.
...

 # Test the accuracy:
 print("\n\nModel Evaluation:")
 test_loss, test_acc =self.model.evaluate(self.test_input, self.test_label)
 print("Evaluated Accuracy:", test_acc)
Then, I used my neural network model to make predictions on the rainfall intensity with a given prediction array consisting of readings from the weather station after the training of the model. As a starting point, the model works fine :)
The model predicts possibilities of labels for each input element as an array of 5 numbers. They represent the model's "confidence" that the given input element corresponds to each of the five different classes of rainfall intensity [0 - 4].
⭐ In the make_prediction() function, make a prediction for each input element in a given array and get the most accurate label [0 - 4] by using the argmax() function to display its class name.
def make_prediction(self, pre_array):
 print("\n\nModel Predictions:\n")
 prediction =self.model.predict(pre_array)
 for i in range(len(pre_array)):
 print("Prediction => ", self.class_names[np.argmax(prediction[i])])
Prediction Inputs:
- [0, 0, 0.31819805, 0.31819805, 0.6988, 0.81498571, 0.99349753]
- [0, -0, 0, -0, 0.8444, 1, 0.96835143]
- [0, 0, 0.45, 0, 0.87577, 0.95857143, 1.00128332]
- [-0, -0, -0, -0, 0.8224, 1.05714286, 0.99279368]
Prediction Outputs:
- 0 [None]
- 3 [Heavy Rain]
- 4 [Violent Rain]
- 4 [Violent Rain]

Connections and Adjustments (ESP8266)
// Connections
// NodeMCU ESP-12E (ESP8266) :
// Weather Station
// VV --------------------------- 5V
// D5 --------------------------- RX
// D6 --------------------------- TX
// G --------------------------- GND
I connected the sensor (converter) board to the NodeMCU ESP-12E (ESP8266) development board and fastened them to a plastic box while collecting weather data at my balcony.
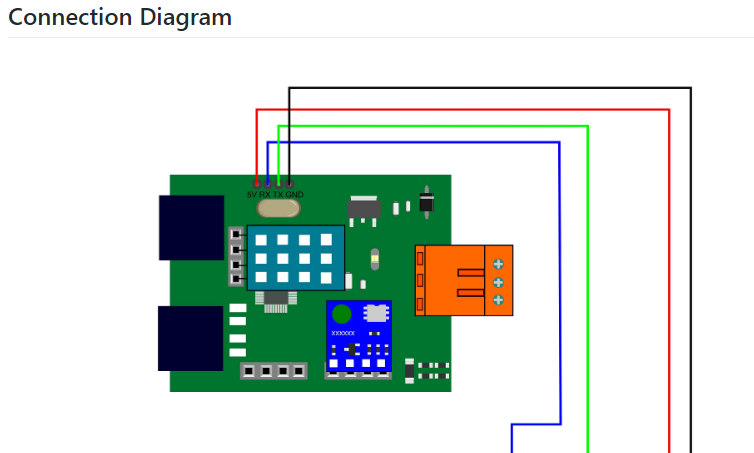
Connections and Adjustments (SIM808)
// Connections
// Arduino Uno:
// SIM808 GPS/GPRS/GSM Shield For Arduino
// D0 --------------------------- RX
// D1 --------------------------- TX
// D12 --------------------------- POWER
// Weather Station
// 5V --------------------------- 5V
// D5 --------------------------- RX
// D6 --------------------------- TX
// GND --------------------------- GND
⭐ Note:D0, D1, D12 pins are occupied by the SIM808 GPS/GPRS/GSM Shield.
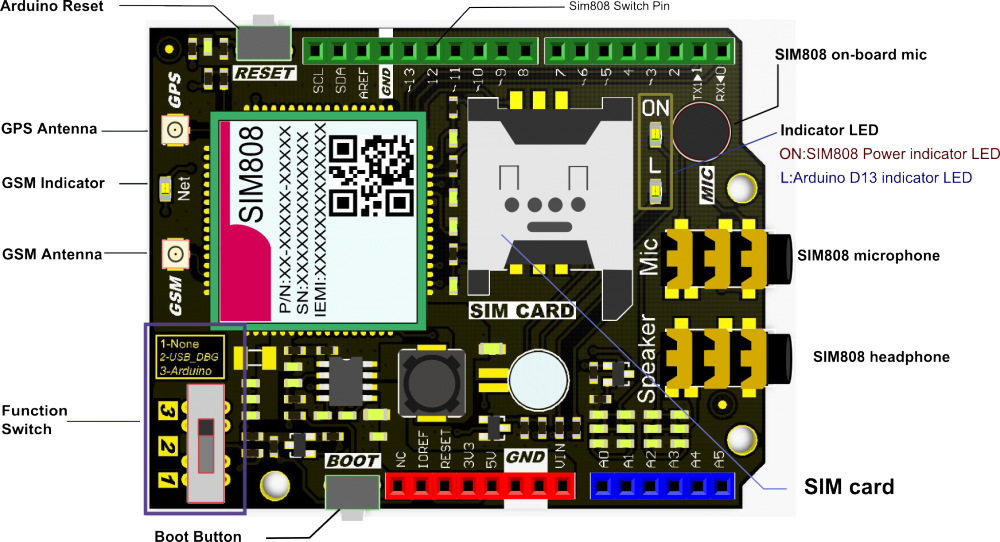
⭐ Connect an external battery (7-23V) for the SIM808 module to work properly.
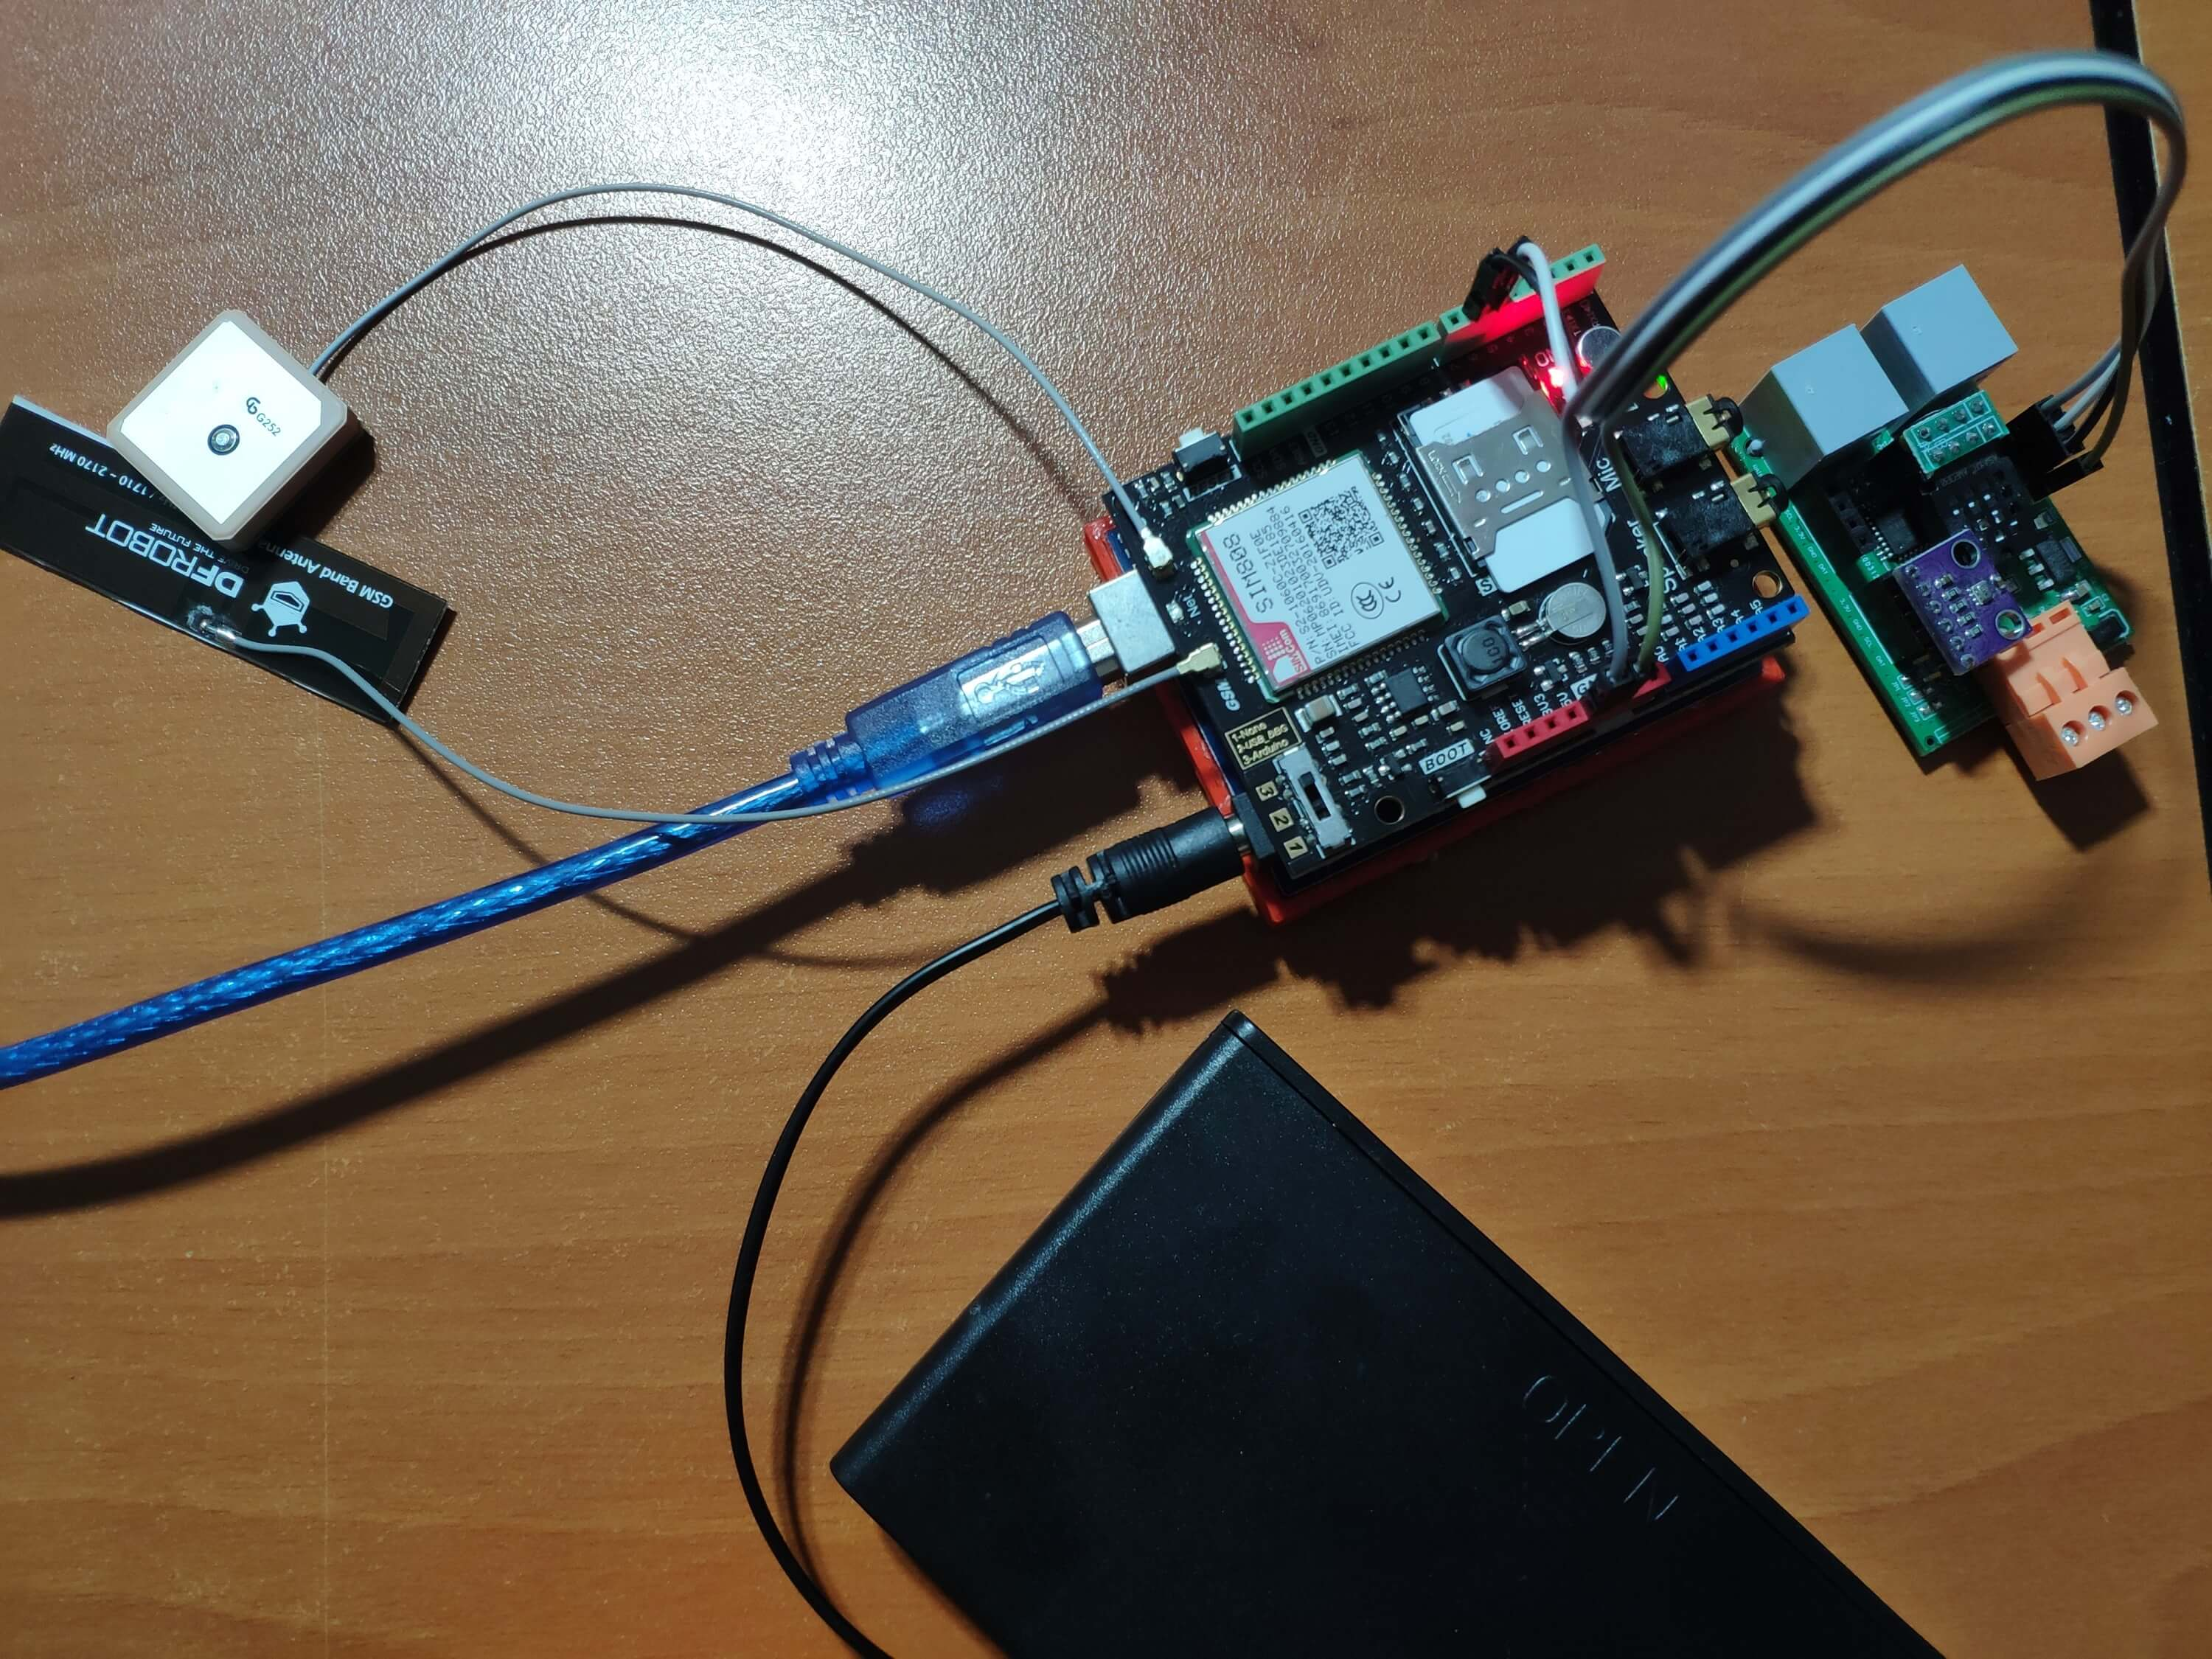
⭐ Attach the GPS antenna and the GSM antenna to the SIM808 shield.
⭐ Insert a SIM card into the SIM slot on the SIM808 shield.
⭐ Before uploading the code, set the function switch on the shield to None (1).
⭐ Upload the code.
⭐ Then, set the function switch to Arduino (3).
⭐ Press the Boot button on the shield until seeing the Net indicator LED flashing every 1 second and wait for the SIM card to register the network - the Net indicator LED will slowly flash every 3 seconds.
⭐ Click here to get more information about the SIM808 GSM/GPS/GPRS Shield.
After setting up the SIM808 shield with Arduino Uno, I connected the sensor (converter) board to it.
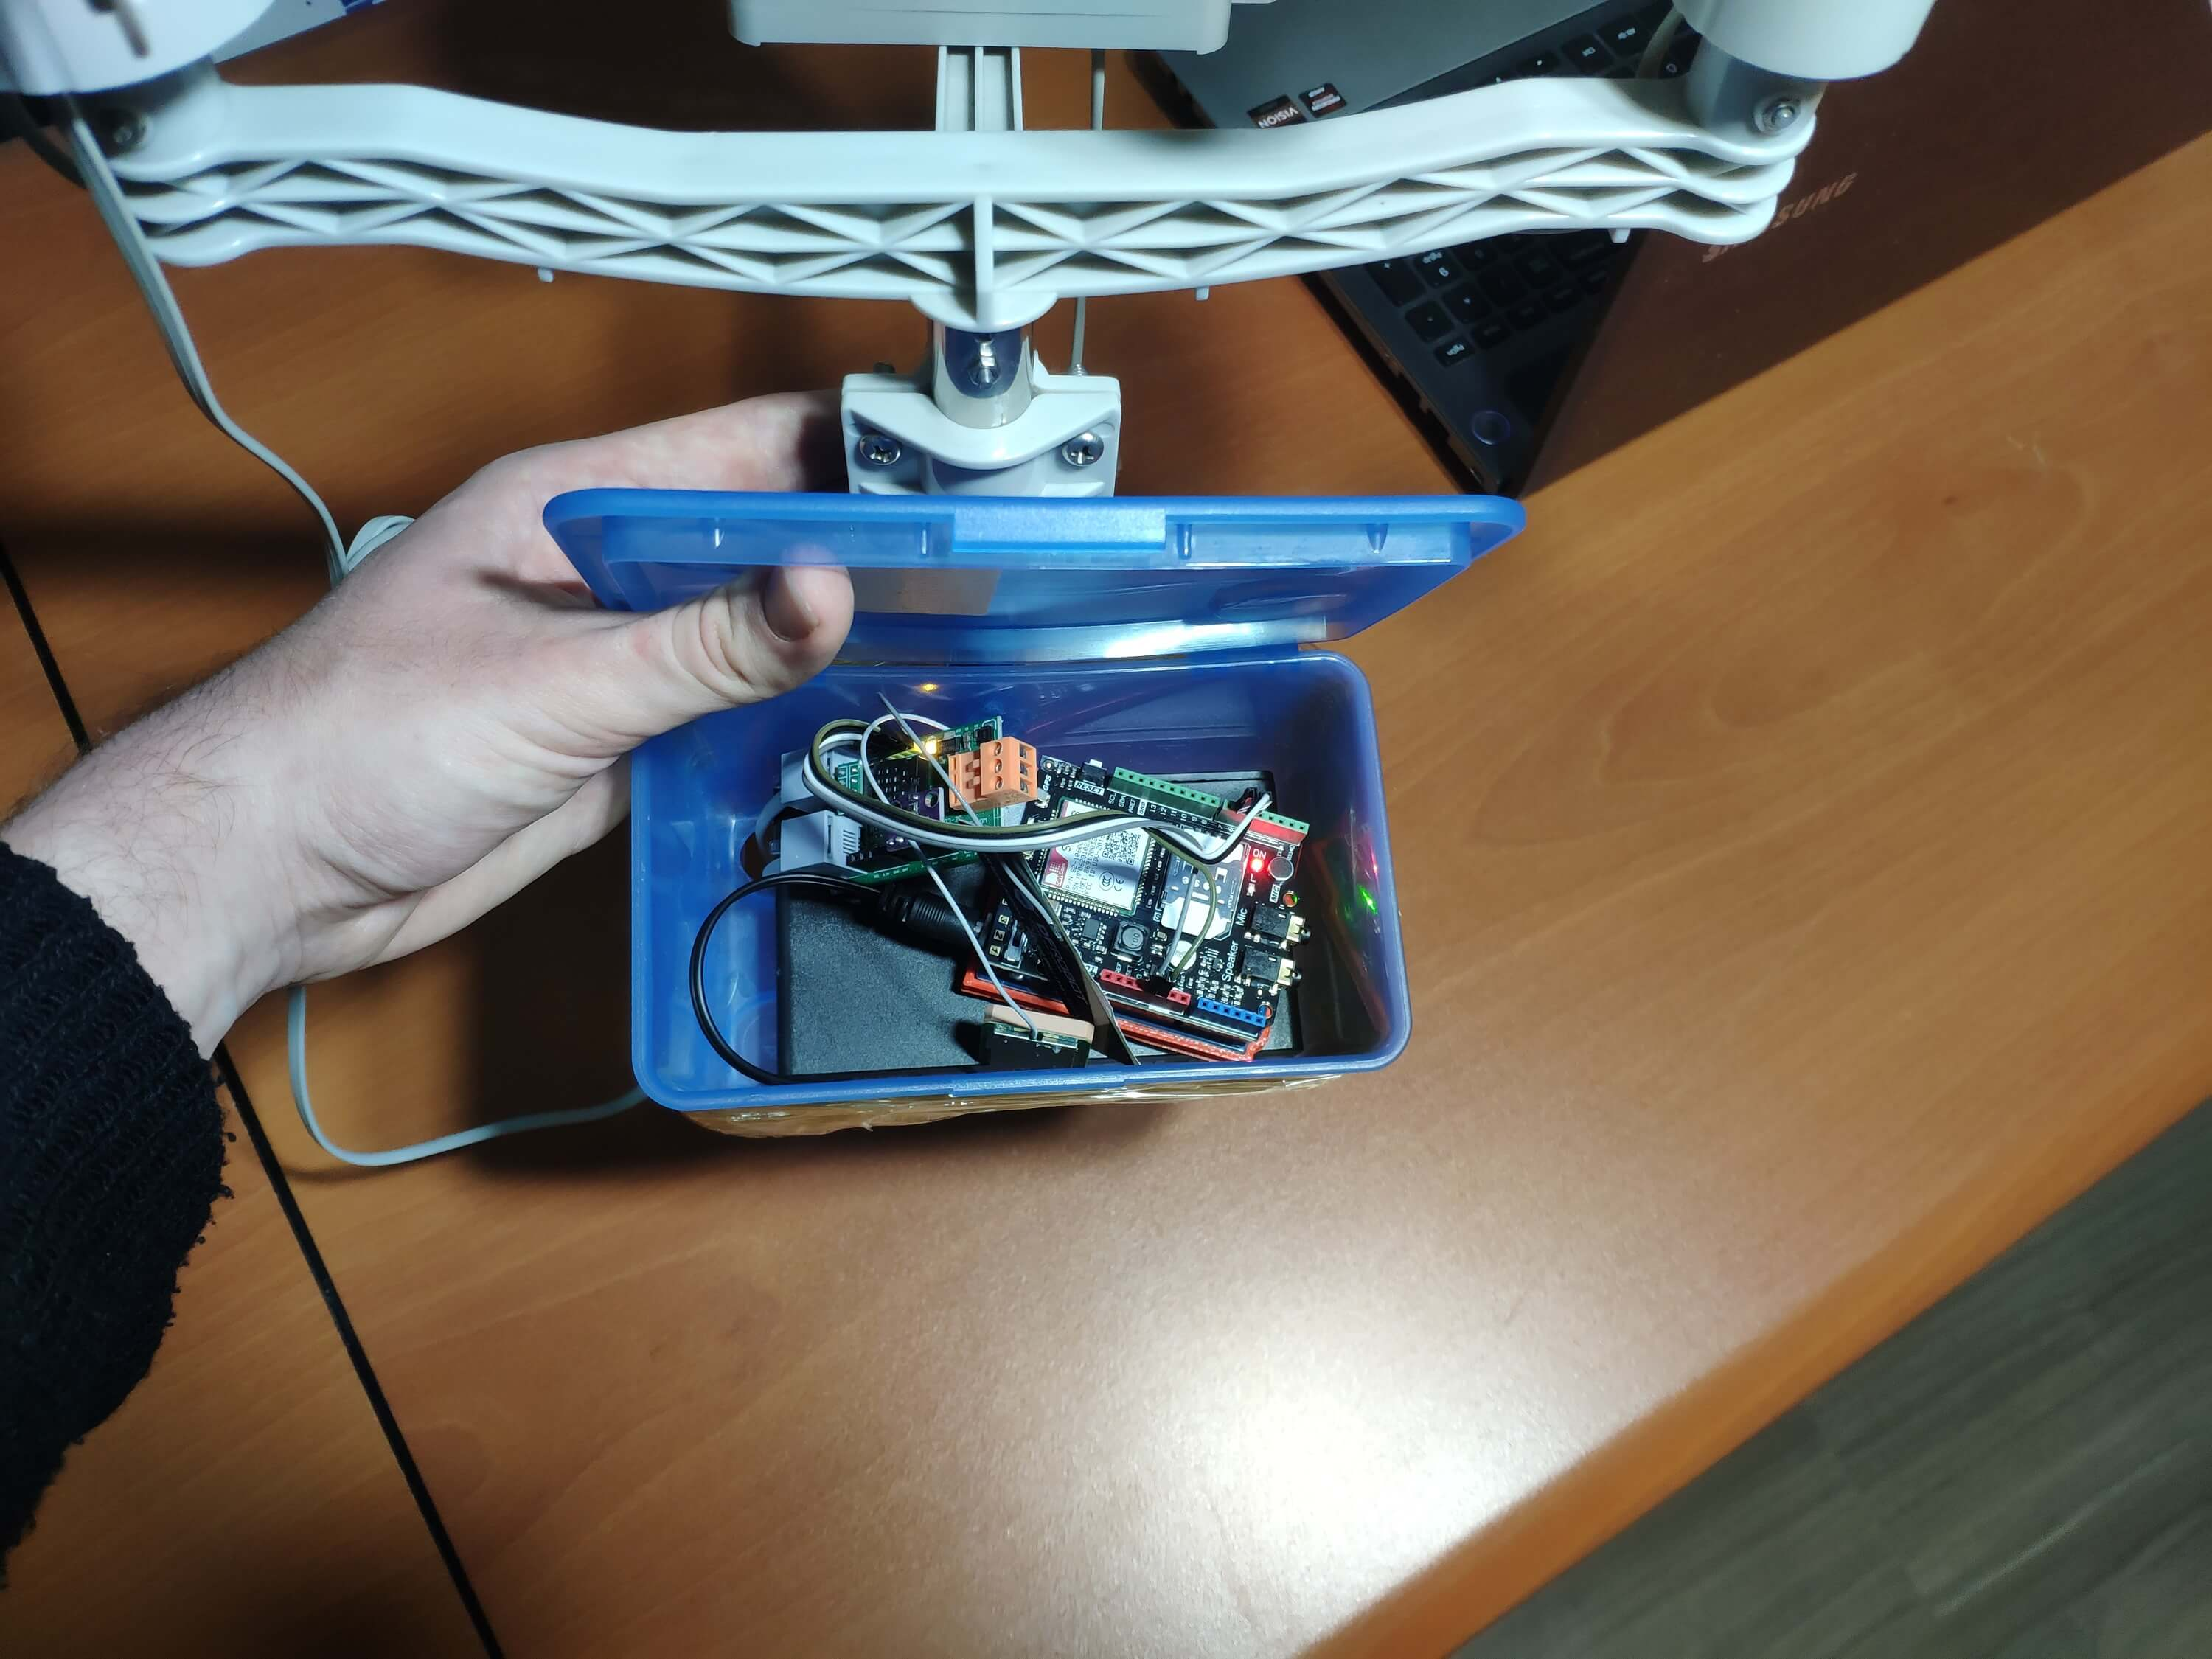
I placed all components into a plastic box to collect weather data outside, even in extreme weather conditions, since the sensor board is not weather-proof.
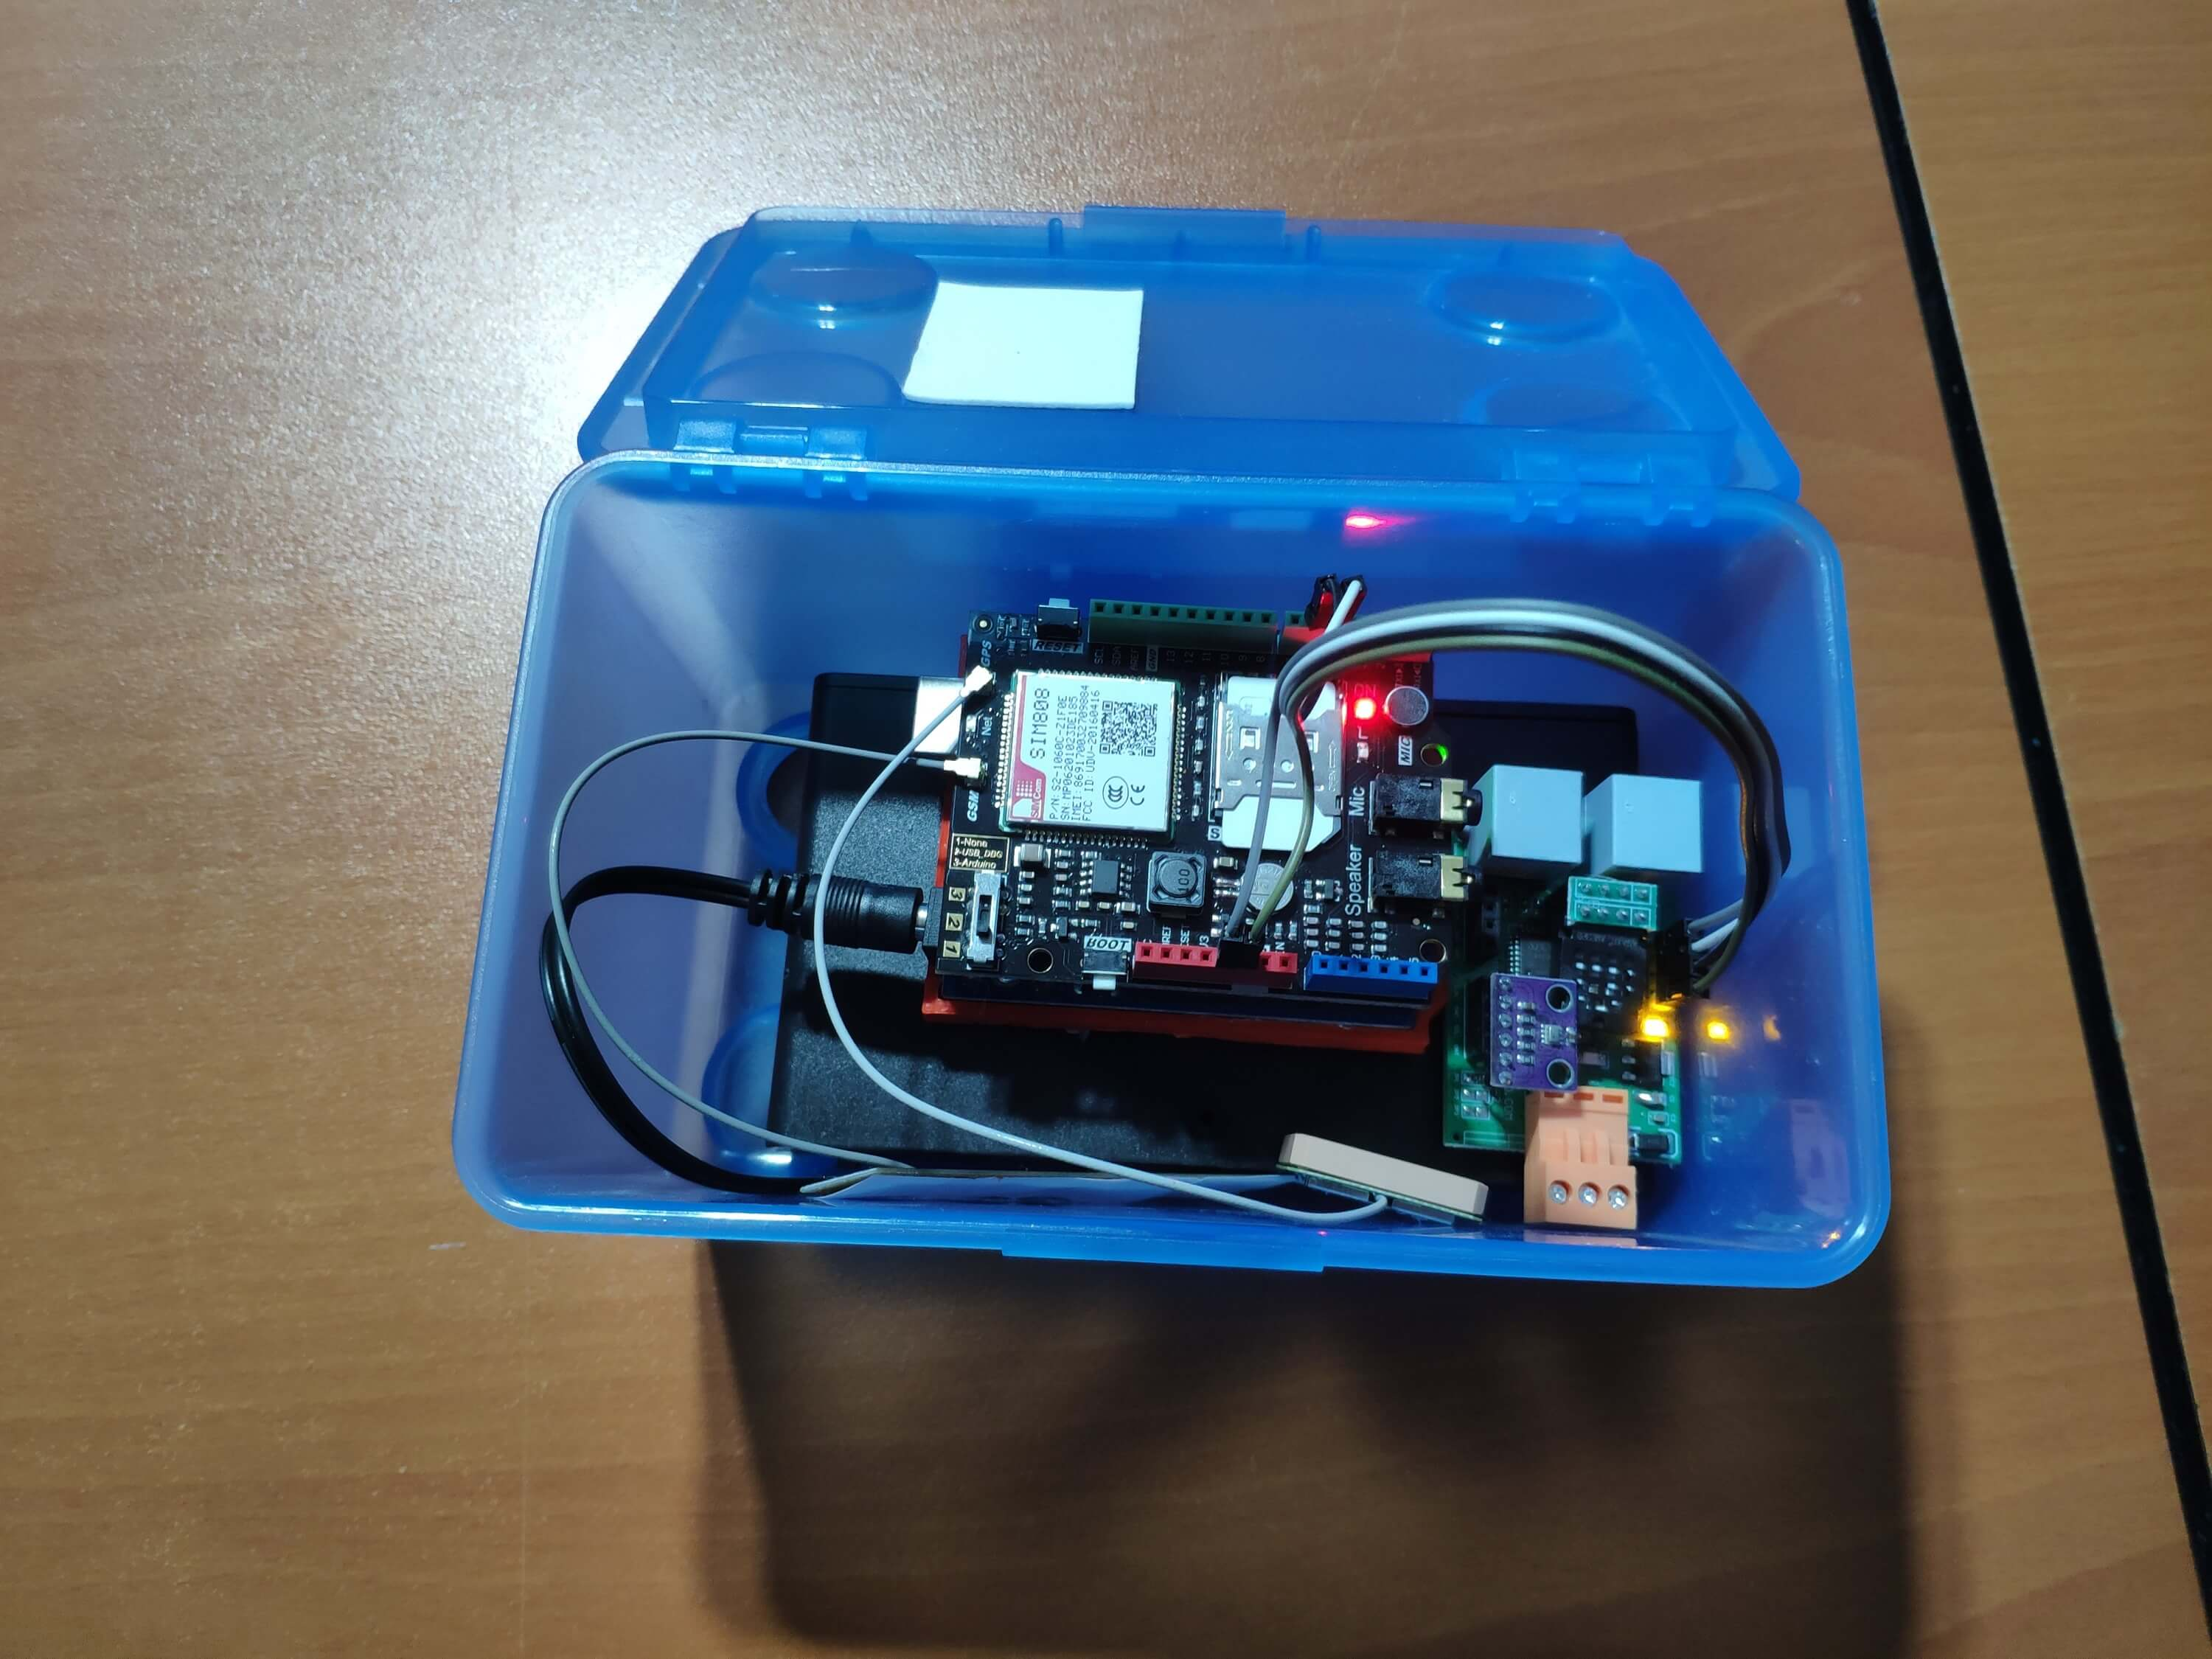
Then, I fastened the plastic box to the weather station.
Videos and Conclusion
After completing coding and assembling the weather station, I collated local weather data for more than three months every five minutes to build my neural network model successfully.
I am still collecting weather data at my balcony and backyard to improve my neural network model and its accuracy :)
Further Discussions
☔ 💧 Since we need local weather data sets to get more accurate predictions on weather phenomena, budget-friendly NN-enabled weather stations like this can be placed on farms and greenhouses to avert the detrimental effects of excessive rainfall on agriculture.
☔ 💧 As early warning systems working with neural networks, we can use them simultaneously to create a swarm of weather stations communicating and feeding each other to forecast rainfall intensity precisely in local areas.
☔ 💧 Also, we can utilize that information for assessing:
- vital water resources,
- agriculture,
- crop productivity,
- ecosystems,
- hydrology.
Referenties
[1] Extreme weather - heavy rainfall , NIWA, https://niwa.co.nz/natural-hazards/extreme-weather-heavy-rainfall
[2] University of Illinois at Urbana-Champaign, News Bureau. "Excessive rainfall as damaging to corn yield as extreme heat, drought. " ScienceDaily. ScienceDaily, 30 April 2019. www.sciencedaily.com/releases/2019/04/190430121744.htm.
[3] Andrew Culclasure, Using Neural Networks to Provide Local Weather Forecasts , Georgia Southern University, Spring 2013, 29https://digitalcommons.georgiasouthern.edu/cgi/viewcontent.cgi?article=1031&context=etd.
Code
- IoT_weather_station_neural_network.py
- ESP12E_remote_weather_station.ino
- SIM808_remote_weather_station.ino
- index.php (web application)
- account_verification_token.php (web application)
IoT_weather_station_neural_network.pyPython
# IoT Weather Station Predicting Rainfall Intensity w/ TensorFlow# Windows, Linux, or Ubuntu# By Kutluhan Aktar# Collates weather data on Google Sheets and interprets it with a neural network built in TensorFlow to make predictions on the rainfall intensity. # For more information:# https://www.theamplituhedron.com/projects/IoT_Weather_Station_Predicting_Rainfall_Intensity_with_TensorFlowimport tensorflow as tffrom tensorflow import kerasimport matplotlib.pyplot as pltimport numpy as npimport pandas as pd# Create a class to build a neural network after getting, visualizing, and scaling (normalizing) weather data.class Weather_Station:def __init__(self, data):self.df =data self.input =[] self.label =[] # Define class names for different rainfall intensity predictions and values. self.class_names =['None', 'Light Rain', 'Moderate Rain', 'Heavy Rain', 'Violent Rain'] # Create graphics for requested columns. def graphics(self, column_1, column_2, xlabel, ylabel):# Show requested columns from the data set:plt.style.use("dark_background") plt.gcf().canvas.set_window_title('IoT Weather Station') plt.hist2d(self.df[column_1], self.df[column_2]) plt.colorbar() plt.xlabel(xlabel) plt.ylabel(ylabel) plt.title(xlabel) plt.show() # Visualize data before creating and feeding the neural network model. def data_visualization(self):# Inspect requested columns to build a model with appropriately formatted data:self.graphics('WD', '1h_RF', 'Wind Direction (deg)', 'One-Hour Rainfall (mm)') self.graphics('Av_WS', '1h_RF', 'Average Wind Speed (m/s)', 'One-Hour Rainfall (mm)') self.graphics('Mx_WS', '1h_RF', 'Maximum Wind Speed (m/s)', 'One-Hour Rainfall (mm)') self.graphics('24h_RF', '1h_RF', '24-Hour Rainfall (mm)', 'One-Hour Rainfall (mm)') self.graphics('Tem', '1h_RF', 'Temperature (C)', 'One-Hour Rainfall (mm)') self.graphics('Hum', '1h_RF', 'Humidity (%)', 'One-Hour Rainfall (mm)') self.graphics('b_PR', '1h_RF', 'Barometric Pressure (hPA)', 'One-Hour Rainfall (mm)') # Scale (normalize) data depending on the neural network model. def scale_data(self):# Wind Direction and Speed:wv =self.df.pop('Av_WS') max_wv =self.df.pop('Mx_WS') # Convert to radians. wd_rad =self.df.pop('WD')*np.pi / 180 # Calculate the wind x and y components. self.df['scaled_WX'] =wv*np.cos(wd_rad) self.df['scaled_WY'] =wv*np.sin(wd_rad) # Calculate the max wind x and y components. self.df['scaled_max_WX'] =max_wv*np.cos(wd_rad) self.df['scaled_max_WY'] =max_wv*np.sin(wd_rad) # Temperature:tem =self.df.pop('Tem') self.df['scaled_Tem'] =tem / 25 # Humidity:hum =self.df.pop('Hum') self.df['scaled_Hum'] =hum / 70 # Barometric Pressure:bPR =self.df.pop('b_PR') self.df["scaled_bPR"] =bPR / 1013 # 24 Hour Rainfall (Approx.) rain_24 =self.df.pop('24h_RF') self.df['scaled_24h_RF'] =rain_24 / 24 # Define the input and label arrays. def create_input_and_label(self):n =len(self.df) # Create the input array using the scaled variables:for i in range(n):self.input.append(np.array([self.df['scaled_WX'][i], self.df['scaled_WY'][i], self.df['scaled_max_WX'][i], self.df['scaled_max_WY'][i], self.df['scaled_Tem'][i], self.df['scaled_Hum'][i], self.df['scaled_bPR'][i]])) self.input =np.asarray(self.input) # Create the label array using the one-hour and 24-hour rainfall variables:for i in range(n):_class =0 # Evaluate the approximate rainfall rate:approx_RF_rate =(self.df['1h_RF'][i] + self.df['scaled_24h_RF'][i]) * 100 # As labels, assign classes of rainfall intensity according to the approximate rainfall rate (mm):if approx_RF_rate ==0:_class =0 elif approx_RF_rate <2.5:_class =1 elif 2.5 ", self.class_names[np.argmax(prediction[i])]) # Save the model for further usage without training steps:def save_model(self):self.model.save("E:\PYTHON\weather_station.h5") # Run Artificial Neural Network (ANN):def Neural_Network(self, save):self.scale_data() self.create_input_and_label() self.split_data() self.build_and_train_model() if save ==True:self.save_model() # Example Input and Layer:print("\nScaled Input [EXP]:\n") print(self.train_input[0]) print("\nScaled Label [EXP]:\n") print(self.train_label[0]) # Read data (Remote Weather Station.csv):csv_path ="E:\PYTHON\Remote Weather Station.csv"df =pd.read_csv(csv_path)# Define a new class object named 'station':station =Weather_Station(df)# Visualize data:#station.data_visualization()# Artificial Neural Network (ANN):station.Neural_Network(False)# Enter inputs for making predictions:prediction_array =np.array([ [0, 0, 0.31819805, 0.31819805, 0.6988, 0.81498571, 0.99349753], [0, -0, 0, -0, 0.8444, 1, 0.96835143], [0, 0, 0.45, 0, 0.87577, 0.95857143, 1.00128332], [-0, -0, -0, -0, 0.8224, 1.05714286, 0.99279368]])# Prediction Results:station.make_prediction(prediction_array) ESP12E_remote_weather_station.inoArduino
///////////////////////////////////////////// // IoT Weather Station Predicting // // Rainfall Intensity w/ TensorFlow // // ------------------------ // // NodeMCU (ESP-12E) // // by Kutluhan Aktar // // // ///////////////////////////////////////////////// Collates weather data on Google Sheets and interprets it with a neural network built in TensorFlow to make predictions on the rainfall intensity. //// For more information:// https://www.theamplituhedron.com/projects/IoT_Weather_Station_Predicting_Rainfall_Intensity_with_TensorFlow//// Connections// NodeMCU (ESP-12E) :// Weather Station// VV --------------------------- 5V// D5 --------------------------- RX// D6 --------------------------- TX// G --------------------------- GND// Include required libraries:#include#include #include #include #include // Define your WiFi settings.const char *ssid =" ";const char *password =" ";// Define weather station settings:char databuffer[35];double temp;int transferring =0;// Define the serial connection pins - RX and TX.SoftwareSerial Serial_1(D6, D5); // (Rx, Tx)void setup() { // Wait until connected. vertraging (1000); // Initiate serial ports:Serial.begin(115200); Serial_1.begin(9600); // It is just for assuring if connection is alive. WiFi.mode(WIFI_OFF); vertraging (1000); // This mode allows NodeMCU to connect any WiFi directly. WiFi.mode(WIFI_STA); // Connect NodeMCU to your WiFi. WiFi.begin(ssid, password); Serial.print("\n\n"); Serial.print("Try to connect to WiFi. Please wait! "); Serial.print("\n\n"); // Halt the code until connected to WiFi. while (WiFi.status() !=WL_CONNECTED) { delay(500); Serial.print("*"); } // If connection is successful:Serial.print("\n\n"); Serial.print("-------------------------------------"); Serial.print("\n\n"); Serial.print("Connection is successful!"); Serial.print("\n\n"); Serial.print("Connected WiFi SSID :"); Serial.print(ssid); Serial.print("\n\n"); Serial.println("Connected IPAddress :"); Serial.println(WiFi.localIP()); Serial.print("\n\n");}void loop() { // Get data from the remote weather station:getBuffer(); // Debug the information and create the link:String weather_data ="wd=" + String(WindDirection()) + "&a_ws=" + String(WindSpeedAverage()) + "&m_ws=" + String(WindSpeedMax()) + "&1_rf=" + String(RainfallOneHour()) + "&24_rf=" + String(RainfallOneDay()) + "&tem=" + String(Temperature()) + "&hum=" + String(Humidity()) + "&b_pr=" + String(BarPressure()); String server ="http://192.168.1.24/remote_weather_station/?"; Serial.println("Weather Data => " + weather_data); Serial.println("Buffer => " + String(databuffer)); // Send data packets every 5 minutes to Raspberry Pi (or any server). transferring++; Serial.println("Time => " + String(transferring) + "s / " + String(int(5*60)) + "s\n\n"); if(transferring ==5*60){ // Create the HTTP object to make a request to the server. HTTPClient http; http.begin(server + weather_data); int httpCode =http.GET(); String payload =http.getString(); Serial.println("Data Send...\nHTTP Code => " + String(httpCode) + "\nServer Response => " + payload + "\n\n"); http.end(); transferring =0; } // Wait 1 second... delay(1000);}// WEATHER STATIONvoid getBuffer(){ int index; for (index =0;index <35;index ++){ if(Serial_1.available()){ databuffer[index] =Serial_1.read(); if (databuffer[0] !='c'){ index =-1; } } else{ index --; } }}int transCharToInt(char *_buffer, int _start, int _stop){ int _index; int result =0; int num =_stop - _start + 1; int _temp[num]; for (_index =_start;_index <=_stop;_index ++){ _temp[_index - _start] =_buffer[_index] - '0'; result =10*result + _temp[_index - _start]; } return result;}int WindDirection(){ return transCharToInt(databuffer,1,3); } // Wind Direction (deg)float WindSpeedAverage(){ temp =0.44704 * transCharToInt(databuffer,5,7); return temp; } // Average Air Speed (1 minute)float WindSpeedMax(){ temp =0.44704 * transCharToInt(databuffer,9,11); return temp; } //Max Air Speed (5 minutes)float Temperature(){ temp =(transCharToInt(databuffer,13,15) - 32.00) * 5.00 / 9.00; return temp; } // Temperature ("C")float RainfallOneHour(){ temp =transCharToInt(databuffer,17,19) * 25.40 * 0.01; return temp; } // Rainfall (1 hour)float RainfallOneDay(){ temp =transCharToInt(databuffer,21,23) * 25.40 * 0.01; return temp; } // Rainfall (24 hours)int Humidity(){ return transCharToInt(databuffer,25,26); } // Humidity (%)float BarPressure(){ temp =transCharToInt(databuffer,28,32); return temp / 10.00; } // Barometric Pressure (hPA)
SIM808_remote_weather_station.inoArduino
///////////////////////////////////////////// // IoT Weather Station Predicting // // Rainfall Intensity w/ TensorFlow // // ------------------------ // // Arduino Uno (SIM808) // // by Kutluhan Aktar // // // ///////////////////////////////////////////////// Collates weather data on Google Sheets and interprets it with a neural network built in TensorFlow to make predictions on the rainfall intensity. //// For more information:// https://www.theamplituhedron.com/projects/IoT_Weather_Station_Predicting_Rainfall_Intensity_with_TensorFlow//// Connections// Arduino Uno:// SIM808 GPS/GPRS/GSM Shield For Arduino// D0 --------------------------- RX// D1 --------------------------- TX// D12 --------------------------- POWER // Weather Station// 5V --------------------------- 5V// D5 --------------------------- RX// D6 --------------------------- TX// GND --------------------------- GND// Include required libraries:#include#include // Define the sim808.DFRobot_SIM808 sim808(&Serial);// Define weather station settings:char databuffer[35];double temp;int transferring =0;// Define the serial connection pins - RX and TX.SoftwareSerial Serial_1(6, 5); // (Rx, Tx)void setup() { // Wait until connected. vertraging (1000); // Initiate serial ports:Serial.begin(9600); Serial_1.begin(9600); //******** Initialize sim808 module ************* while(!sim808.init()) { delay(1000); Serial.print("Sim808 init error\r\n"); } delay(2000); // Continue if the SIM808 Module is working accurately. Serial.println("Sim808 init success"); delay(5000);}void loop() { // Get data from the remote weather station:getBuffer(); // Debug the information and create the link:String weather_data_1 ="wd=" + String(WindDirection()) + "&a_ws=" + String(WindSpeedAverage()) + "&m_ws=" + String(WindSpeedMax()); String weather_data_2 ="&1_rf=" + String(RainfallOneHour()) + "&24_rf=" + String(RainfallOneDay()) + "&tem=" + String(Temperature()); String weather_data_3 ="&hum=" + String(Humidity()) + "&b_pr=" + String(BarPressure()); Serial.print("Weather Data => " + weather_data_1); Serial.print(weather_data_2); Serial.println(weather_data_3); Serial.println("Buffer => " + String(databuffer)); // Send data packets every 5 minutes to the server. transferring++; Serial.println("Time => " + String(transferring) + "s / " + String(int(5*60)) + "s\n\n"); if(transferring ==5*60){ //*********** Attempt DHCP ******************* while(!sim808.join(F("cmnet"))) { Serial.println("Sim808 join network error!"); vertraging (2000); } //************ Successful DHCP **************** delay(5000); Serial.println("Successful DHCP"); //*********** Establish a TCP connection ************ if(!sim808.connect(TCP,"192.168.1.24", 80)) { // Change it with your server. Serial.println("Connection Error"); }else{ Serial.println("Connection OK"); } delay(2000); //*********** Send a GET request ***************** String line ="GET /remote_weather_station/?" + weather_data_1 + weather_data_2 + weather_data_3 + " HTTP/1.0\r\n\r\n"; Serial.println(regel); char buffer[512]; // Convert the line from string to char array to make an HTTP Get Request with the SIM808. char web_hook[110]; String_to_Char(line, 110, web_hook); sim808.send(web_hook, sizeof(web_hook)-1); while (true) { int ret =sim808.recv(buffer, sizeof(buffer)-1); if (ret <=0){ Serial.println("Fetch Over..."); pauze; } // Uncomment to view the response in the serial monitor. /* buffer[ret] ='\0'; Serial.print("Recv:"); Serial.print(ret); Serial.print(" bytes:"); Serial.println(buffer); */ Serial.println("\nData Send"); pauze; } //************* Close TCP or UDP connections ********** sim808.close(); //*** Disconnect wireless connection, Close Moving Scene ******* sim808.disconnect(); // Exit. transferring =0; } // Wait 1 second... delay(1000);}// WEATHER STATIONvoid getBuffer(){ int index; for (index =0;index <35;index ++){ if(Serial_1.available()){ databuffer[index] =Serial_1.read(); if (databuffer[0] !='c'){ index =-1; } } else{ index --; } }}int transCharToInt(char *_buffer, int _start, int _stop){ int _index; int result =0; int num =_stop - _start + 1; int _temp[num]; for (_index =_start;_index <=_stop;_index ++){ _temp[_index - _start] =_buffer[_index] - '0'; result =10*result + _temp[_index - _start]; } return result;}int WindDirection(){ return transCharToInt(databuffer,1,3); } // Wind Direction (deg)float WindSpeedAverage(){ temp =0.44704 * transCharToInt(databuffer,5,7); return temp; } // Average Air Speed (1 minute)float WindSpeedMax(){ temp =0.44704 * transCharToInt(databuffer,9,11); return temp; } //Max Air Speed (5 minutes)float Temperature(){ temp =(transCharToInt(databuffer,13,15) - 32.00) * 5.00 / 9.00; return temp; } // Temperature ("C")float RainfallOneHour(){ temp =transCharToInt(databuffer,17,19) * 25.40 * 0.01; return temp; } // Rainfall (1 hour)float RainfallOneDay(){ temp =transCharToInt(databuffer,21,23) * 25.40 * 0.01; return temp; } // Rainfall (24 hours)int Humidity(){ return transCharToInt(databuffer,25,26); } // Humidity (%)float BarPressure(){ temp =transCharToInt(databuffer,28,32); return temp / 10.00; } // Barometric Pressure (hPA)void String_to_Char(String _String, int _size, char _convert[]){ for(int i=0;i<_size;i++){ _convert[i] =_String[i]; }}
index.php (web application)PHP
 (int)$_GET['wd'], "a_ws" => (float)$_GET['a_ws'], "m_ws" => (float)$_GET['m_ws'], "1_rf" => (float)$_GET['1_rf'], "24_rf" => (float)$_GET['24_rf'], "tem" => (float)$_GET['tem'], "hum" => (int)$_GET['hum'], "b_pr" => (float)$_GET['b_pr'] ];}else{ $variables_from_module =[ "wd" => "err", "a_ws" => "err", "m_ws" => "err", "1_rf" => "err", "24_rf" => "err", "tem" => "err", "hum" => "err", "b_pr" => "err" ];}/** * Returns an authorized API client. * @return Google_Client the authorized client object */function getClient(){ $client =new Google_Client(); $client->setApplicationName('Remote Weather Station'); // Enter your application name. $client->setScopes('https://www.googleapis.com/auth/spreadsheets'); $client->setAuthConfig('credentials.json'); $client->setAccessType('offline'); $client->setPrompt('select_account consent'); // Load previously authorized token from a file, if it exists. // The file token.json stores the user's access and refresh tokens, and is // created automatically when the authorization flow completes for the first // time. $tokenPath ='token.json'; if (file_exists($tokenPath)) { $accessToken =json_decode(file_get_contents($tokenPath), true); $client->setAccessToken($accessToken); print("Token Found!"); } // If there is no previous token or it's expired. if ($client->isAccessTokenExpired()) { // Refresh the token if possible, else fetch a new one. if ($client->getRefreshToken()) { $client->fetchAccessTokenWithRefreshToken($client->getRefreshToken()); } else { // Request authorization from the user. $authUrl =$client->createAuthUrl(); // Do not forget to refresh the page after getting the verification code and entering it to the account_verification_token.php. printf("Open the following link in your browser:

%s

", $authUrl); // <=Comment print 'Do not forget to refresh the page after getting the verification code and entering it to the account_verification_token.php.

Set the verification code in the account_verification_token.php file.'; // <=Comment // Set the verification code to create the token.json. $authCode =trim($GLOBALS['account_verification_token']); // Exchange authorization code for an access token. $accessToken =$client->fetchAccessTokenWithAuthCode($authCode); $client->setAccessToken($accessToken); // Check to see if there was an error and the account_verification_token is entered. if (array_key_exists('error', $accessToken)) { throw new Exception(join(', ', $accessToken)); }else{ print("Successful! Refresh the page."); } } // Save the token to a file. if (!file_exists(dirname($tokenPath))) { mkdir(dirname($tokenPath), 0700, true); } file_put_contents($tokenPath, json_encode($client->getAccessToken())); } return $client;}// Get the API client and construct the service object.$client =getClient();$service =new Google_Service_Sheets($client);// Enter your spreadsheetId:$spreadsheetId ='';// Enter the range (the first row) under which new values will be appended (8 rows):$range ='A1:H1';// Append recent findings from the weather station to the spreadsheet.$values =[ [$variables_from_module["wd"], $variables_from_module["a_ws"], $variables_from_module["m_ws"], $variables_from_module["1_rf"], $variables_from_module["24_rf"], $variables_from_module["tem"], $variables_from_module["hum"], $variables_from_module["b_pr"]]];$body =new Google_Service_Sheets_ValueRange([ 'values' => $values]);$params =[ 'valueInputOption' => "RAW"];// Append if only requested!if(isset($_GET['wd']) &&isset($_GET['a_ws']) &&isset($_GET['m_ws']) &&isset($_GET['1_rf']) &&isset($_GET['24_rf']) &&isset($_GET['tem']) &&isset($_GET['hum']) &&isset($_GET['b_pr'])){ $result =$service->spreadsheets_values->append($spreadsheetId, $range, $body, $params); printf("

%d cells appended.", $result->getUpdates()->getUpdatedCells());}else{ print ("
Missing Data!");}
account_verification_token.php (web application)PHP
"; // Enter the verification code after authorization. ?>
Aangepaste onderdelen en behuizingen
remote_weather_station_OobOCQNPSW.csvSchema's
Productieproces
- Weerstation gebaseerd op Raspberry Pi
- Raspberry Pi 2 weerstation
- Raspberry Pi-weerstation
- IoT 101-project:stream de temperatuur van je Raspberry Pi
- Bewaking op afstand van het weer met Raspberry Pi
- Doe mee met het IOT met je weerstation – CWOP
- Java ME 8 + Raspberry Pi + Sensors =IoT World (deel 1)
- Raspberry PI-gebaseerd IoT-project dat DHT11-sensor verbindt
- Windows 10 IoT Core op Raspberry Pi 2 – Adafruit-sensorgegevens
- Weerstation V 2.0
- Windows 10 IoT Core voor Raspberry Pi 3 Model B+